empty
was formed on 02.04 at 01:30:23 (UTC+0)
signal strength 3 of 5
Double Top #Bitcoin M30

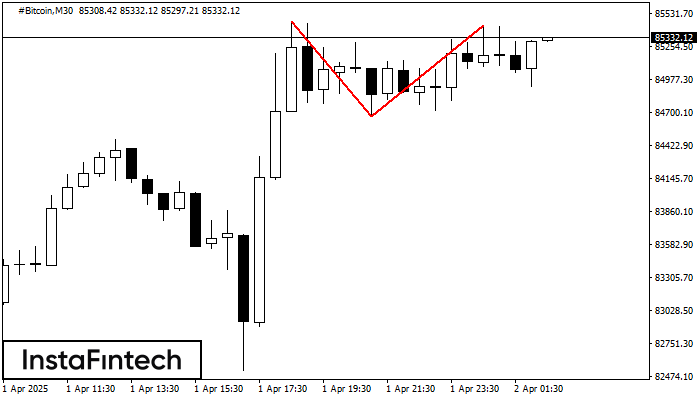
The Double Top pattern has been formed on #Bitcoin M30. It signals that the trend has been changed from upwards to downwards. Probably, if the base of the pattern 84666.85 is broken, the downward movement will continue.

ดูเพิ่มเติม

Figure
  • All
  • Double Top
  • Flag
  • Head and Shoulders
  • Pennant
  • Rectangle
  • Triangle
  • Triple top
Instrument
  • All
  • #AAPL
  • #AMZN
  • #Bitcoin
  • #EBAY
  • #FB
  • #GOOG
  • #INTC
  • #KO
  • #MA
  • #MCD
  • #MSFT
  • #NTDOY
  • #PEP
  • #TSLA
  • #TWTR
  • AUDCAD
  • AUDCHF
  • AUDJPY
  • AUDUSD
  • EURCAD
  • EURCHF
  • EURGBP
  • EURJPY
  • EURNZD
  • EURRUB
  • EURUSD
  • GBPAUD
  • GBPCHF
  • GBPJPY
  • GBPUSD
  • GOLD
  • NZDCAD
  • NZDCHF
  • NZDJPY
  • NZDUSD
  • SILVER
  • USDCAD
  • USDCHF
  • USDJPY
  • USDRUB
Timeframe
  • All
  • M5
  • M15
  • M30
  • H1
  • D1
Trend
  • All
  • Buy
  • Sale
Signal Strength
  • All
  • 1
  • 2
  • 3
  • 4
  • 5
Double Bottom
was formed on 10.04 at 23:00:28 (UTC+0)
signal strength 1 of 5
Double Bottom NZDCHF M5

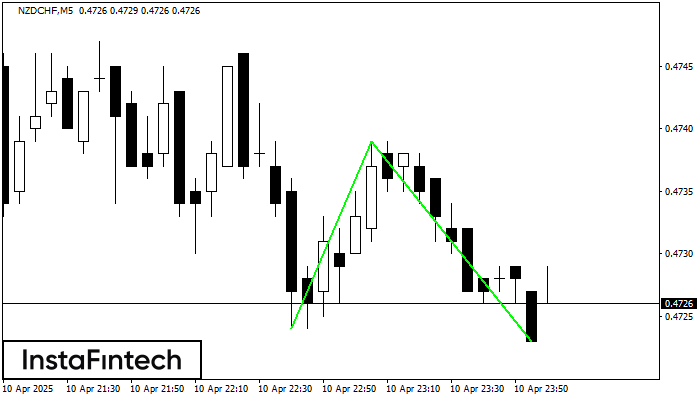
The Double Bottom pattern has been formed on NZDCHF M5. Characteristics: the support level 0.4724; the resistance level 0.4739; the width of the pattern 15 points. If the resistance level

The M5 and M15 time frames may have more false entry points.

Open chart in a new window
Bearish Symmetrical Triangle
was formed on 10.04 at 22:58:48 (UTC+0)
signal strength 1 of 5
Bearish Symmetrical Triangle NZDCAD M5

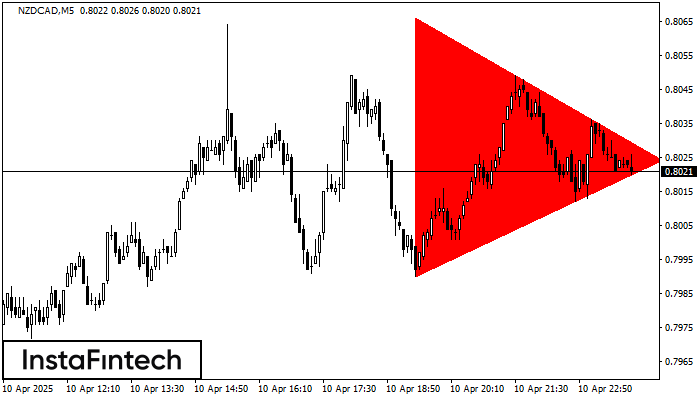
According to the chart of M5, NZDCAD formed the Bearish Symmetrical Triangle pattern. This pattern signals a further downward trend in case the lower border 0.7990 is breached. Here

The M5 and M15 time frames may have more false entry points.

Open chart in a new window
Bullish Rectangle
was formed on 10.04 at 22:51:41 (UTC+0)
signal strength 1 of 5
Bullish Rectangle GOLD M5

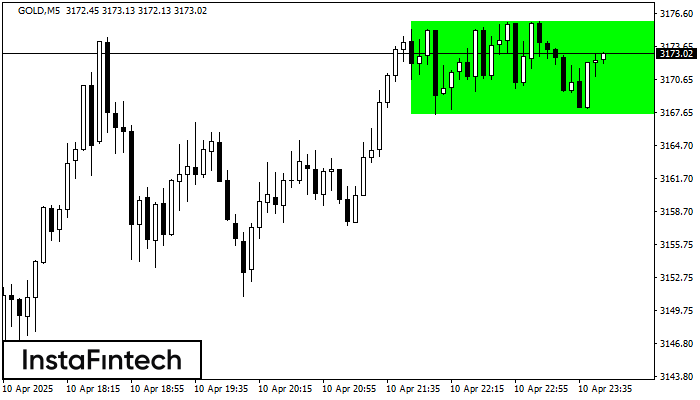
According to the chart of M5, GOLD formed the Bullish Rectangle. This type of a pattern indicates a trend continuation. It consists of two levels: resistance 3175.88 and support 3167.51

The M5 and M15 time frames may have more false entry points.

Open chart in a new window
หากไม่สะดวกคุยในตอนนี้
ระบุคำถามไว้ได้ใน แชท.
Widget callback
 

Dear visitor,

Your IP address shows that you are currently located in the USA. If you are a resident of the United States, you are prohibited from using the services of InstaFintech Group including online trading, online transfers, deposit/withdrawal of funds, etc.

If you think you are seeing this message by mistake and your location is not the US, kindly proceed to the website. Otherwise, you must leave the website in order to comply with government restrictions.

Why does your IP address show your location as the USA?

  • - you are using a VPN provided by a hosting company based in the United States;
  • - your IP does not have proper WHOIS records;
  • - an error occurred in the WHOIS geolocation database.

Please confirm whether you are a US resident or not by clicking the relevant button below. If you choose the wrong option, being a US resident, you will not be able to open an account with InstaForex anyway.

We are sorry for any inconvenience caused by this message.