empty
03.02.2025 12:33 PM
Weekly Forecast Based on Simplified Wave Analysis for EUR/USD, USD/JPY, GBP/JPY, USD/CAD, NZD/USD, and Bitcoin – February 3

EUR/USD

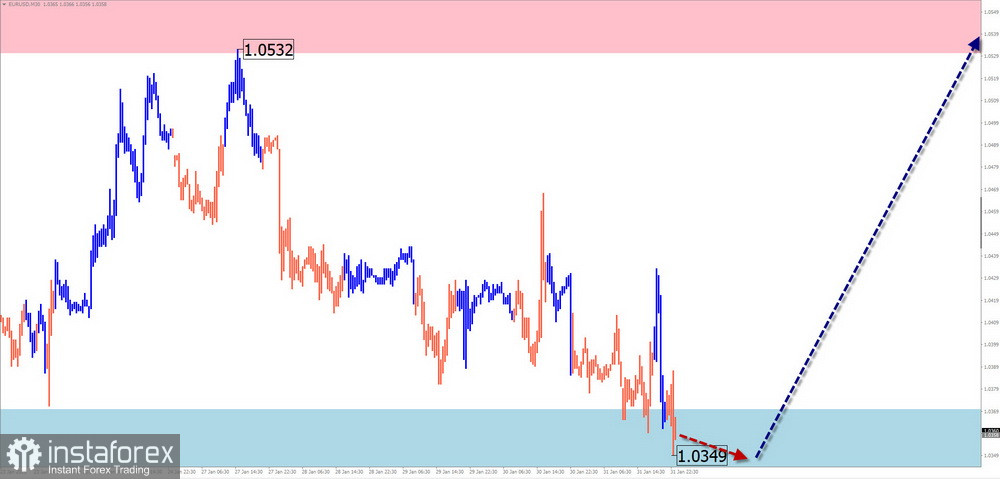
Analysis:Since October of last year, the euro's price movement has followed a downward wave algorithm. A counter-correction has been forming since the start of the year, taking the shape of an extended flat pattern, which is nearing completion. The resistance zone aligns with the lower boundary of a potential large-scale reversal zone.

Forecast:In the first half of the upcoming week, further pressure on the euro toward the support zone is likely. A pause and potential reversal may occur in this area, with a resumption of upward movement expected by the end of the week.

This image is no longer relevant

Potential Reversal Zones:

  • Resistance: 1.0530 / 1.0580
  • Support: 1.0370 / 1.0320

Recommendations:

  • Buy: Consider after confirmed reversal signals near the support zone.
  • Sell: No potential; likely to result in losses.

USD/JPY

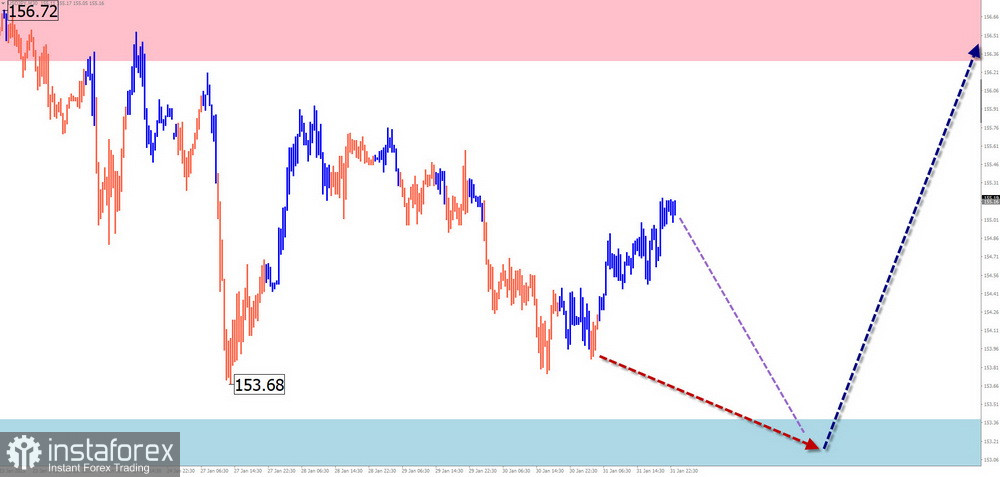
Analysis:The bullish wave for the Japanese yen began in August of last year. Since December, a counter-correction (B) has been developing, which remains incomplete at the time of analysis. Over the past week, the pair has formed a potential upward reversal wave pattern.

Forecast:In the next few days, expect a sideways movement with a gradual shift toward the support zone. The second half of the week could bring increased volatility, with a possible reversal and resumption of the uptrend.

This image is no longer relevant

Potential Reversal Zones:

  • Resistance: 156.30 / 156.80
  • Support: 153.40 / 152.90

Recommendations:

  • Buy: Possible with small volume sizes after confirmed reversal signals within the support zone.
  • Sell: Intraday positions with small volume sizes; close trades at the first signs of reversal.

GBP/JPY

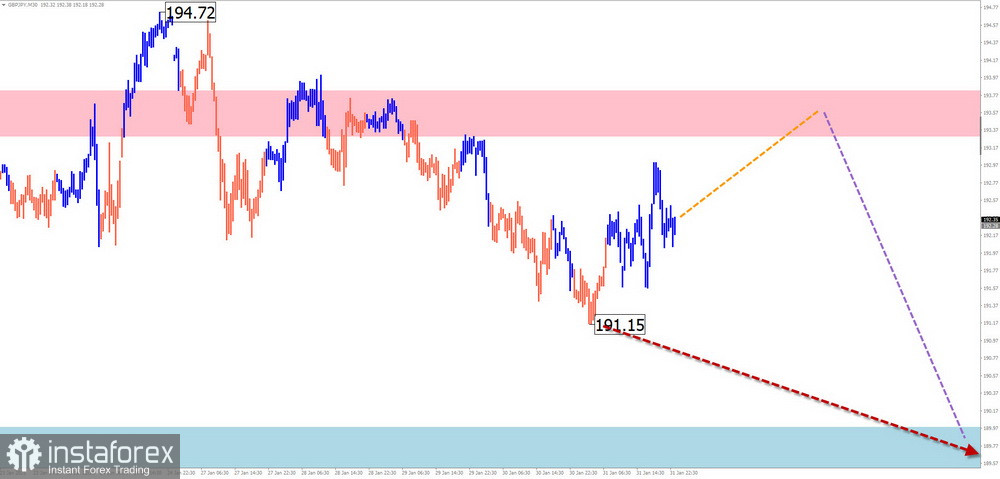
Analysis:On the GBP/JPY pair, the most notable wave for trading is the unfinished upward wave from December 3 of last year. Since January 13, the final part (C) has been forming, creating a shifting flat pattern.

Forecast:In the upcoming week, expect the pair to move sideways. A downward movement toward the support zone is possible in the first few days, with a resumption of upward momentum expected closer to the weekend.

This image is no longer relevant

Potential Reversal Zones:

  • Resistance: 193.30 / 193.80
  • Support: 191.00 / 190.50

Recommendations:

  • Sell: Intraday positions with small volume sizes.
  • Buy: After confirmed reversal signals in the support zone, buying becomes the priority for trading.

USD/CAD

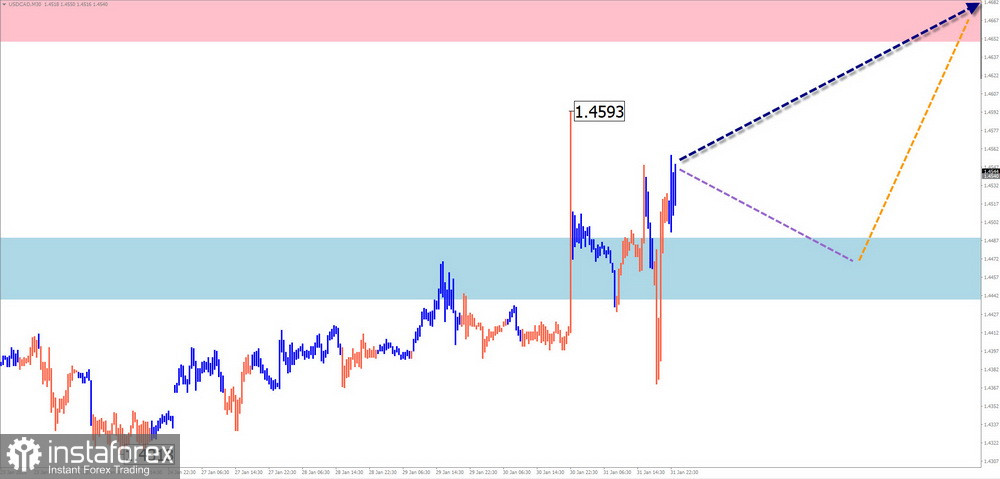
Analysis:Since late September, the uptrend in USD/CAD has followed an ascending wave algorithm. After a flat correction that ended two weeks ago, the price is now forming the final upward leg. Recently, the pair broke through strong resistance, which has now become support.

Forecast:Following a possible pullback and pressure on the support zone, a reversal and return to the general uptrend can be expected. The resistance zone marks the upper boundary of a potential weekly reversal zone.

This image is no longer relevant

Potential Reversal Zones:

  • Resistance: 1.4650 / 1.4700
  • Support: 1.4490 / 1.4440

Recommendations:

  • Sell: Risky under current market conditions.
  • Buy: Possible with small volume sizes after confirmed reversal signals near the support zone.

NZD/USD

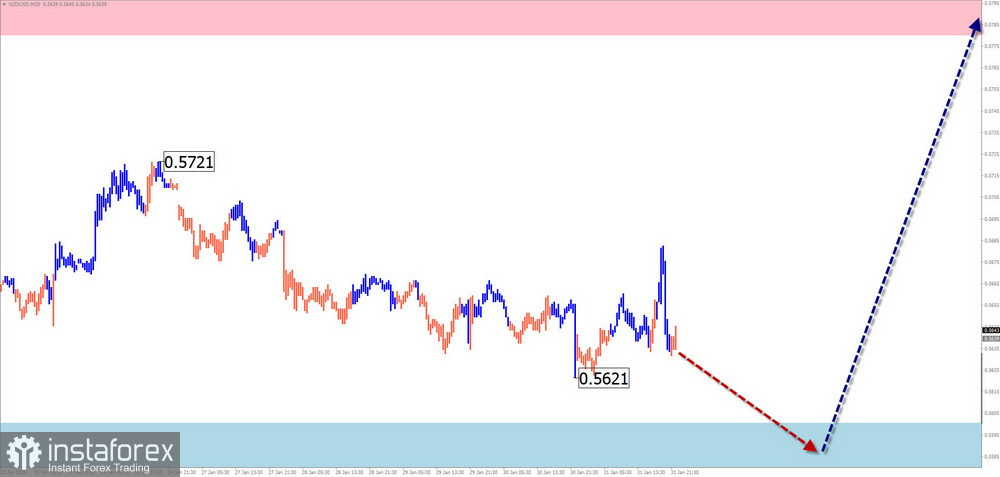
Analysis:The unfinished wave structure in NZD/USD has a downward trajectory that began in mid-July last year. The corrective wave (B) started in December and remains incomplete. Prices are near the boundaries of a potential reversal zone.

Forecast:In the coming days, a reversal formation near the support zone is likely. Some downward pressure and a brief decline below support may occur, with increased activity expected closer to the weekend.

This image is no longer relevant

Potential Reversal Zones:

  • Resistance: 0.5780 / 0.5830
  • Support: 0.5600 / 0.5550

Recommendations:

  • Sell: No favorable conditions expected this week.
  • Buy: Possible after confirmed reversal signals near the support zone.

Bitcoin

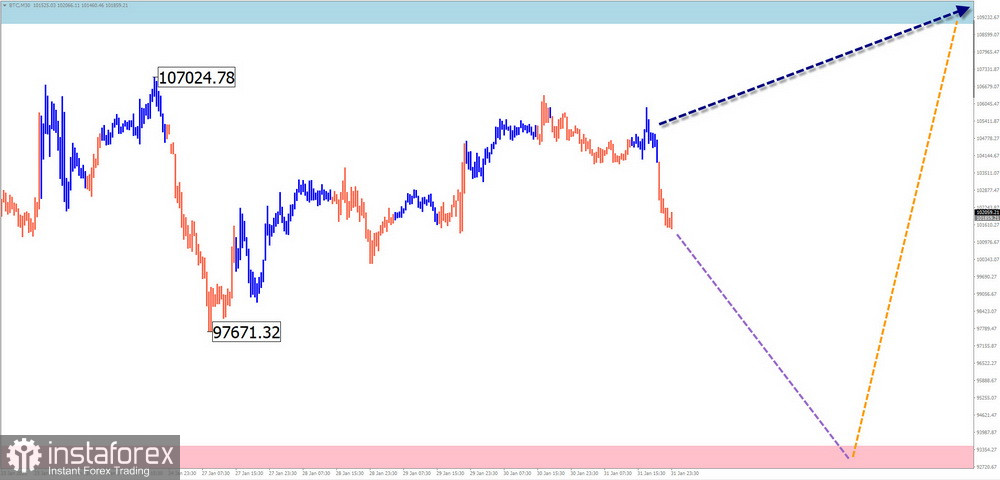
Analysis:Since August of last year, Bitcoin's price fluctuations have followed an upward wave algorithm. A counter-wave (B) has been developing since mid-December, with prices moving sideways within a potential weekly reversal zone. The wave structure is not yet complete.

Forecast:At the start of the week, Bitcoin's price is likely to decline toward the support zone. After forming a reversal, expect price growth toward the resistance zone.

This image is no longer relevant

Potential Reversal Zones:

  • Resistance: 109,000.0 / 110,000.0
  • Support: 94,500.0 / 93,500.0

Recommendations:

  • Sell: Possible with small volume sizes during individual sessions but with limited potential.
  • Buy: Becomes relevant after confirmed reversal signals near the support zone.

Explanation:

In Simplified Wave Analysis (SWA), all waves consist of three parts (A-B-C). The last, incomplete wave is analyzed on each time frame. Dotted lines indicate expected price movements.

Note: The wave algorithm does not account for the duration of price movements over time!

EURUSD
Euro vs US Dollar
Summary
Neutral
Urgency
1 week
Analytic
Vyacheslav Ognev
Start trade
Gana con los cambios en el valor de las criptomonedas con InstaForex.
Descarga MetaTrader 4 y abre tu primera operación.
  • Depósito al azar
    ¡Haga un depósito en su cuenta de $3,000 y obtenga $8000 más!
    ¡En Marzo, sorteamos $8000 dentro de la campaña Depósito afortunado!
    Obtenga la oportunidad de ganar depositando $3,000 en una cuenta de operaciones. Tras haber cumplido esta condición, se convertirá en un participante de la campaña.
    UNIRSE AL CONCURSO

Recommended Stories

NG 12 Feb. ¡Los toros mantienen el rumbo hacia un máximo de 4,31!

El marco temporal de cuatro horas muestra el trazado de una onda activa principal (Y), que tiene una forma interna compleja y es un doble zigzag de un nivel

Roman Onegin 07:26 2025-02-12 UTC+2

SP500 12 de febrero. ¡Después de la finalización de la segunda parte del impulso, el precio puede subir más activamente!

Lo más probable es que se esté formando una tendencia alcista mayor en el panorama global del SP500, cuya estructura es similar a la del impulso. Si nos fijamos

Roman Onegin 07:26 2025-02-12 UTC+2

Análisis del par EUR/USD. El 7 de julio. ¿Dónde se encuentra la raíz de todos los problemas del dólar?

El conteo de ondas en el gráfico de 4 horas para el instrumento EUR/USD permanece sin cambios. Actualmente estamos observando la formación de la supuesta onda

Chin Zhao 15:58 2024-07-07 UTC+2

Análisis del par EUR/USD. El 6 de julio. El destino complicado del dólar.

El conteo de ondas en el gráfico de 4 horas para el instrumento EUR/USD permanece sin cambios. Actualmente estamos observando la formación de la supuesta onda

Chin Zhao 15:57 2024-07-07 UTC+2

Análisis del par GBP/USD. El 6 de julio. La libra quiere caer, pero no puede.

La estructura de ondas del instrumento GBP/USD sigue siendo bastante complicada y muy confusa. Alrededor del nivel de 1.2822, que corresponde al 23.6% de Fibonacci y está cerca del pico

Chin Zhao 15:57 2024-07-07 UTC+2

Análisis del par GBP/USD. El 22 de junio. El mercado espera la primera bajada de los tipos de interés en agosto.

El patrón de onda para el instrumento GBP/USD sigue siendo bastante complicado y confuso. Un intento exitoso de romper el nivel de Fibonacci del 50,0% en abril indicó

Chin Zhao 13:12 2024-06-22 UTC+2

Análisis del par EUR/USD. El 22 de junio. La Fed: No está lista para el aterrizaje.

En el gráfico de 4 horas, no hay cambios en la marca de la onda para el instrumento EUR/USD. En este momento, observamos la construcción de la esperada onda

Chin Zhao 10:51 2024-06-22 UTC+2

Análisis del par GBP/USD. El 8 de junio. Los británicos retrocedieron, pero no se rindieron.

El patrón de onda para el instrumento GBP/USD sigue siendo bastante complicado. El intento exitoso de romper el nivel de Fibonacci del 50,0% en abril indicó que el mercado está

Chin Zhao 08:27 2024-06-09 UTC+2

Análisis del par EUR/USD. El 8 de junio. El BCE confía en una mayor desaceleración de la inflación.

El patrón de onda del gráfico de 4 horas para el instrumento EUR/USD se mantiene sin cambios. En este momento, estamos observando la construcción de la onda esperada

Chin Zhao 08:26 2024-06-09 UTC+2

EUR/USD. Análisis del 2 de octubre. Las estadísticas europeas vuelven a decepcionar y el euro vuelve a caer

El análisis de ondas del gráfico de 4 horas para el par euro/dólar sigue siendo bastante claro. Durante el año pasado, solo hemos visto tres estructuras onduladas que se alternan

Chin Zhao 17:48 2023-10-02 UTC+2
¿No puede hablar ahora mismo?
Ingrese su pregunta en el chat.
Widget callback
 

Dear visitor,

Your IP address shows that you are currently located in the USA. If you are a resident of the United States, you are prohibited from using the services of InstaFintech Group including online trading, online transfers, deposit/withdrawal of funds, etc.

If you think you are seeing this message by mistake and your location is not the US, kindly proceed to the website. Otherwise, you must leave the website in order to comply with government restrictions.

Why does your IP address show your location as the USA?

  • - you are using a VPN provided by a hosting company based in the United States;
  • - your IP does not have proper WHOIS records;
  • - an error occurred in the WHOIS geolocation database.

Please confirm whether you are a US resident or not by clicking the relevant button below. If you choose the wrong option, being a US resident, you will not be able to open an account with InstaForex anyway.

We are sorry for any inconvenience caused by this message.