signal strength 1 of 5

According to the chart of M5, GBPCHF formed the Head and Shoulders pattern. The Head’s top is set at 1.1418 while the median line of the Neck is found at 1.1408/1.1408. The formation of the Head and Shoulders pattern evidently signals a reversal of the upward trend. In other words, in case the scenario comes true, the price of GBPCHF will go towards 1.1393.
The M5 and M15 time frames may have more false entry points.
See Also
- All
- Double Top
- Flag
- Head and Shoulders
- Pennant
- Rectangle
- Triangle
- Triple top
- All
- #AAPL
- #AMZN
- #Bitcoin
- #EBAY
- #FB
- #GOOG
- #INTC
- #KO
- #MA
- #MCD
- #MSFT
- #NTDOY
- #PEP
- #TSLA
- #TWTR
- AUDCAD
- AUDCHF
- AUDJPY
- AUDUSD
- EURCAD
- EURCHF
- EURGBP
- EURJPY
- EURNZD
- EURRUB
- EURUSD
- GBPAUD
- GBPCHF
- GBPJPY
- GBPUSD
- GOLD
- NZDCAD
- NZDCHF
- NZDJPY
- NZDUSD
- SILVER
- USDCAD
- USDCHF
- USDJPY
- USDRUB
- All
- M5
- M15
- M30
- H1
- D1
- All
- Buy
- Sale
- All
- 1
- 2
- 3
- 4
- 5
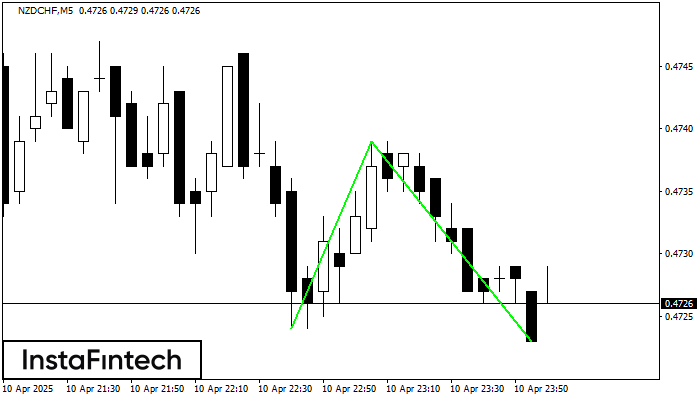
The Double Bottom pattern has been formed on NZDCHF M5. Characteristics: the support level 0.4724; the resistance level 0.4739; the width of the pattern 15 points. If the resistance level
The M5 and M15 time frames may have more false entry points.
Open chart in a new window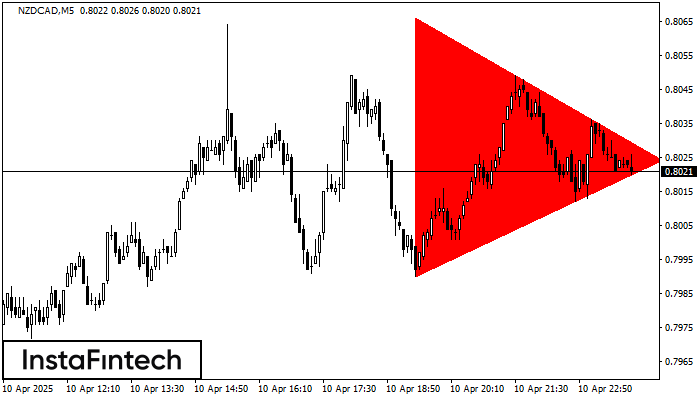
According to the chart of M5, NZDCAD formed the Bearish Symmetrical Triangle pattern. This pattern signals a further downward trend in case the lower border 0.7990 is breached. Here
The M5 and M15 time frames may have more false entry points.
Open chart in a new window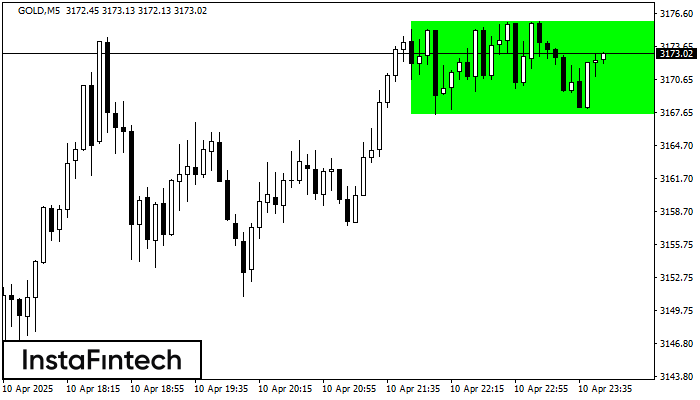
According to the chart of M5, GOLD formed the Bullish Rectangle. This type of a pattern indicates a trend continuation. It consists of two levels: resistance 3175.88 and support 3167.51
The M5 and M15 time frames may have more false entry points.
Open chart in a new window