empty
27.01.2025 12:39 AM
#SPX – Weekly Results and Prospects

#SPX


This image is no longer relevant

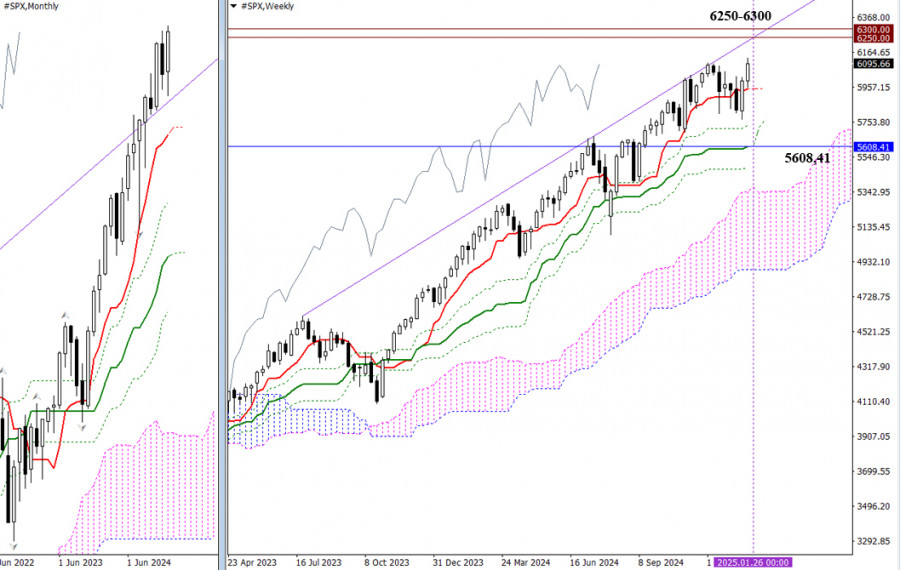
Last year, the index displayed an upward trend, correcting any bearish declines within one to two months at most. As a result, 2024 did not record a single bullish fractal, and record highs were continuously updated. By the end of the year, bearish forces attempted to slow the momentum, but January 2025 marked a new all-time high at 6127.41. In this context, the next bullish target appears to be around the psychologically significant levels of 6250 to 6300. If the bears manage to regain control, the key downside targets on higher timeframes will be the Ichimoku indicator levels: the monthly short-term trend at 5608.41 and the weekly cross supports at Tenkan 5948.42 and Kijun 5608.41.

This image is no longer relevant

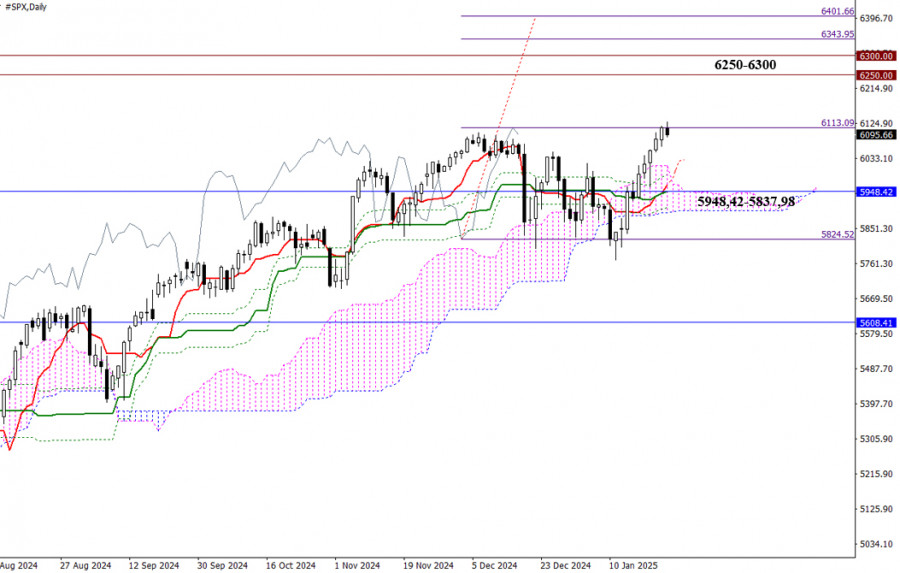
The daily chart indicates that after concluding last year with an emerging bearish correction, the index has rebounded effectively. The bulls successfully halted the decline, eliminated the daily dead cross, returned to the bullish zone above the daily cloud, and targeted an upward breakout for the Chinkou price chart. Currently, the bulls have a strong foundation to continue their upward movement. While the Chinkou Span suggests higher targets in the range of 6344 to 6402, the immediate focus should be on testing the 6250 to 6300 levels and assessing the results of this interaction. If the bulls are unable to breach these levels, the bears could push the market back towards a cluster of multiple supports, which includes the daily cross and daily cloud, near the weekly short-term trend of 5948.42. A decisive break below the range of 5948.42 to 5837.98 could set the stage for a daily downtrend and initiate a new phase of weekly bearish correction.

This image is no longer relevant

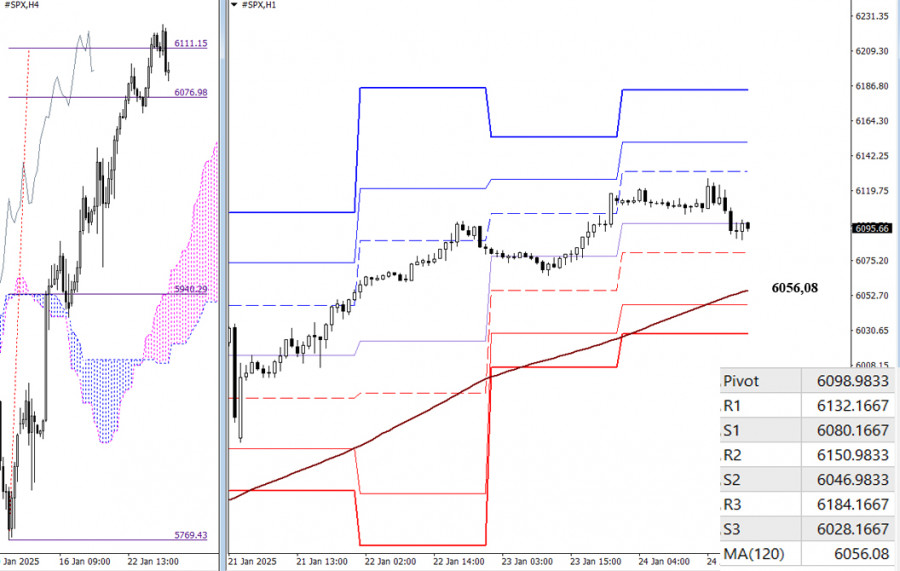
Last week, the H4 chart completed an upward movement, successfully breaking through the H4 Ichimoku cloud at 6111.15. This situation indicates that the bulls may pause, as they might lack the momentum needed for a sustained breakout and further rally. The bears are likely to take advantage of this opportunity, aiming to regain control of the lower timeframes and shift the balance of power in their favor. For the bears to succeed, they need to push the market below the weekly long-term trend at 6056.08 while reversing its current direction.

If the bulls manage to surpass the resistance at the H4 target, we can expect a resurgence of bullish activity. Additionally, the classic Pivot Points offer more references for lower timeframes. New levels will be available when the market opens.

***

Technical Analysis Components:
  • Higher Timeframes: Ichimoku Kinko Hyo (9.26.52) and Fibonacci Kijun levels
  • H1: Classic Pivot Points and 120-period Moving Average (weekly long-term trend)
Evangelos Poulakis,
انسٹافاریکس کا تجزیاتی ماہر
© 2007-2025
ٹائم فریم منتخب کریں
5
منٹ
15
منٹ
30
منٹ
1
گھنٹہ
4
گھنٹے
1
دن
1
ہفتہ
انسٹافاریکس کے ساتھ کرپٹو کرنسی کی معاملاتی تبدیلیوں سے کمائیں۔
میٹا ٹریڈر 4 ڈاؤن لوڈ کریں اور اپنی پہلی ٹریڈ کھولیں۔
  • Grand Choice
    Contest by
    InstaForex
    InstaForex always strives to help you
    fulfill your biggest dreams.
    مقابلہ میں شامل ہوں

تجویز کردہ مضامین

فروری 13-16 2025 کے لیے سونے (ایکس اے یو / یو ایس ڈی) کے لیے تجارتی سگنل: $2,905 سے اوپر خریدیں (21 ایس ایم اے - 6/8 مرے)

ایچ 4 چارٹ کے مطابق، سونا اپنی تیزی کی طاقت دکھا رہا ہے کیونکہ قیمت 21 ایس ایم اے سے اوپر واقع ہے، جو مزید اضافے کا مرحلہ طے کرتی

Dimitrios Zappas 16:04 2025-02-13 UTC+2

فروری 13-16 2025 کے لیے یورو / یو ایس ڈی کے لیے تجارتی اشارہ: 1.0335 سے اوپر خریدیں (21 ایس ایم اے - 200 ای ایم اے)

اگر قیمت اگلے چند گھنٹوں میں 1.0335 سے اوپر مستحکم ہو جاتی ہے، تو یورو زمین حاصل کر سکتا ہے۔ تکنیکی طور پر، بیئرش ٹرینڈ چینل کا شدید وقفہ ہوا۔

Dimitrios Zappas 15:58 2025-02-13 UTC+2

13-16 فروری 2025 کے لیے بٹ کوائن (بی ٹی سی / یو ایس ڈی) کے لیے تجارتی اشارہ: $95,000 سے اوپر خریدیں یا $98,995 سے کم فروخت کریں (21 ایس ایم اے - 200 ای ایم اے)

دوسری طرف، جب تک قیمت $98,900 سے نیچے رہے گی، کسی بھی تکنیکی اچھال کو فروخت کرنے کے موقع کے طور پر دیکھا جائے گا۔ بی ٹی سی کی مختصر

Dimitrios Zappas 15:54 2025-02-13 UTC+2

نیس ڈیک 100 انڈیکس کی ڈیلی پرائس موومنٹ کا تکنیکی تجزیہ، جمعرات 13 فروری 2025۔

اگرچہ فی الحال اس کے یومیہ چارٹ پر Nasdaq 100 انڈیکس اب بھی اوپر کی طرف بڑھ رہا ہے جہاں اس کی اس حرکت سے تصدیق ہوتی

Arief Makmur 12:27 2025-02-13 UTC+2

فروری 12-15 2025 کے لیے سونے (ایکس اے یو / یو ایس ڈی) کے لیے تجارتی سگنل: $2,880-2,907 سے نیچے فروخت (21 ایس ایم اے - تصحیح)

اگر اگلے چند گھنٹوں میں مندی کا رجحان برقرار رہتا ہے، تو ہم توقع کرتے ہیں کہ سونا 2,857 کے قریب تیزی کے رجحان کے چینل کے نیچے تک پہنچ

Dimitrios Zappas 17:27 2025-02-12 UTC+2

فروری 12-15 2025 کے لیے یورو / یو ایس ڈی کے لیے تجارتی سگنل: 1.0384 - 1.0410 سے نیچے فروخت کریں (21 ایس ایم اے - 5/8 مرے)

یورو / یو ایس ڈی 1.0300 پر کلیدی سپورٹ سے اپنی بحالی جاری رکھے ہوئے ہے۔ تاہم، تکنیکی نقطہ نظر مندی کا شکار ہے کیونکہ یہ ٹرینڈ چینل کے اندر

Dimitrios Zappas 17:20 2025-02-12 UTC+2

فروری 11-15 2025 کے لیے سونے (ایکس اے یو / یو ایس ڈی) کے لیے تجارتی سگنل: $2,880 سے اوپر خریدیں (21 ایس ایم اے - واپسی)

دوسری طرف، اگر سونا اگلے چند گھنٹوں میں 2,932 کی ریزسٹنس تک پہنچ جاتا ہے، تو اسے فروخت کی پوزیشنیں دوبارہ شروع کرنے کے موقع کے طور پر دیکھا

Dimitrios Zappas 18:37 2025-02-11 UTC+2

فروری 11-15 2025 کے لیے یورو / یو ایس ڈی کے لیے تجارتی اشارہ: 1.0384 سے نیچے فروخت (21 ایس ایم اے - 5/8 مرے)

اگر یورو موجودہ قیمت کی سطحوں پر مستحکم ہوتا رہتا ہے، تو توقع کی جاتی ہے کہ یورو / یو ایس ڈی مندی کا سلسلہ جاری رکھے گا۔ لہذا،

Dimitrios Zappas 18:34 2025-02-11 UTC+2

فروری 10-12 2025 کے لیے بٹ کوائن (بی ٹی سی) کے لیے تجارتی سگنل: $96,000 سے اوپر خریدیں (200 ای ایم اے - 3/8 مرے)

اس کے برعکس، اگر بٹ کوائن اپنی تکنیکی تصحیح کو جاری رکھتا ہے اور 93,750 سے نیچے مستحکم ہوتا ہے، جو کہ مضبوط حمایت کی نمائندگی کرتا ہے،

Dimitrios Zappas 15:56 2025-02-10 UTC+2

فروری 10-12 2025 کے لیے یورو / یو ایس دی کے لیے تجارتی سگنل: 1.0376 سے نیچے فروخت کریں (21 ایس ایم اے - 200 ای ایم اے)

ممکنہ عالمی تجارتی جنگ پر بڑھتے ہوئے تناؤ کے ساتھ، امریکی ڈالر مضبوط ہو رہا ہے اور بدلے میں، یورو / یو ایس ڈی پر دباؤ ڈال رہا ہے۔

Dimitrios Zappas 15:54 2025-02-10 UTC+2
ابھی فوری بات نہیں کرسکتے ؟
اپنا سوال پوچھیں بذریعہ چیٹ.
Widget callback
 

Dear visitor,

Your IP address shows that you are currently located in the USA. If you are a resident of the United States, you are prohibited from using the services of InstaFintech Group including online trading, online transfers, deposit/withdrawal of funds, etc.

If you think you are seeing this message by mistake and your location is not the US, kindly proceed to the website. Otherwise, you must leave the website in order to comply with government restrictions.

Why does your IP address show your location as the USA?

  • - you are using a VPN provided by a hosting company based in the United States;
  • - your IP does not have proper WHOIS records;
  • - an error occurred in the WHOIS geolocation database.

Please confirm whether you are a US resident or not by clicking the relevant button below. If you choose the wrong option, being a US resident, you will not be able to open an account with InstaForex anyway.

We are sorry for any inconvenience caused by this message.