signal strength 2 of 5

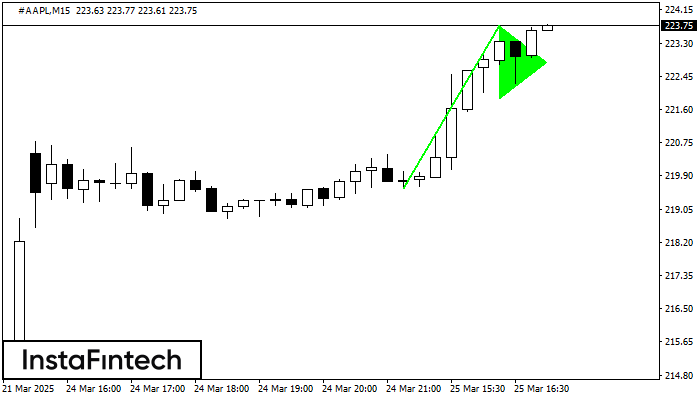
The Bullish pennant graphic pattern has formed on the #AAPL M15 instrument. This pattern type falls under the category of continuation patterns. In this case, if the quote can breaks out high, is expected to continue the upward trend to level 223.96.
The M5 and M15 time frames may have more false entry points.
See Also
- All
- Double Top
- Flag
- Head and Shoulders
- Pennant
- Rectangle
- Triangle
- Triple top
- All
- #AAPL
- #AMZN
- #Bitcoin
- #EBAY
- #FB
- #GOOG
- #INTC
- #KO
- #MA
- #MCD
- #MSFT
- #NTDOY
- #PEP
- #TSLA
- #TWTR
- AUDCAD
- AUDCHF
- AUDJPY
- AUDUSD
- EURCAD
- EURCHF
- EURGBP
- EURJPY
- EURNZD
- EURRUB
- EURUSD
- GBPAUD
- GBPCHF
- GBPJPY
- GBPUSD
- GOLD
- NZDCAD
- NZDCHF
- NZDJPY
- NZDUSD
- SILVER
- USDCAD
- USDCHF
- USDJPY
- USDRUB
- All
- M5
- M15
- M30
- H1
- D1
- All
- Buy
- Sale
- All
- 1
- 2
- 3
- 4
- 5
According to the chart of M5, USDJPY formed the Bullish Rectangle. The pattern indicates a trend continuation. The upper border is 150.63, the lower border is 150.44. The signal means
The M5 and M15 time frames may have more false entry points.
Open chart in a new windowThe Double Top reversal pattern has been formed on GBPJPY M15. Characteristics: the upper boundary 194.76; the lower boundary 194.51; the width of the pattern is 24 points. Sell trades
The M5 and M15 time frames may have more false entry points.
Open chart in a new windowThe Double Top pattern has been formed on USDJPY M15. It signals that the trend has been changed from upwards to downwards. Probably, if the base of the pattern 150.46
The M5 and M15 time frames may have more false entry points.
Open chart in a new window