signal strength 3 of 5
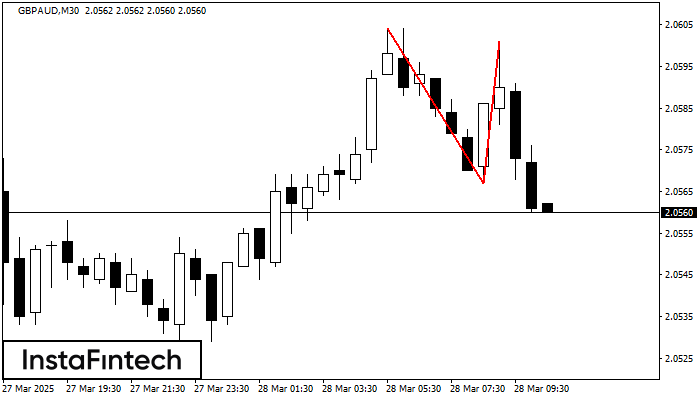
On the chart of GBPAUD M30 the Double Top reversal pattern has been formed. Characteristics: the upper boundary 2.0601; the lower boundary 2.0567; the width of the pattern 34 points. The signal: a break of the lower boundary will cause continuation of the downward trend targeting the 2.0537 level.
Juga lihat
- All
- Double Top
- Flag
- Head and Shoulders
- Pennant
- Rectangle
- Triangle
- Triple top
- All
- #AAPL
- #AMZN
- #Bitcoin
- #EBAY
- #FB
- #GOOG
- #INTC
- #KO
- #MA
- #MCD
- #MSFT
- #NTDOY
- #PEP
- #TSLA
- #TWTR
- AUDCAD
- AUDCHF
- AUDJPY
- AUDUSD
- EURCAD
- EURCHF
- EURGBP
- EURJPY
- EURNZD
- EURRUB
- EURUSD
- GBPAUD
- GBPCHF
- GBPJPY
- GBPUSD
- GOLD
- NZDCAD
- NZDCHF
- NZDJPY
- NZDUSD
- SILVER
- USDCAD
- USDCHF
- USDJPY
- USDRUB
- All
- M5
- M15
- M30
- H1
- D1
- All
- Buy
- Sale
- All
- 1
- 2
- 3
- 4
- 5
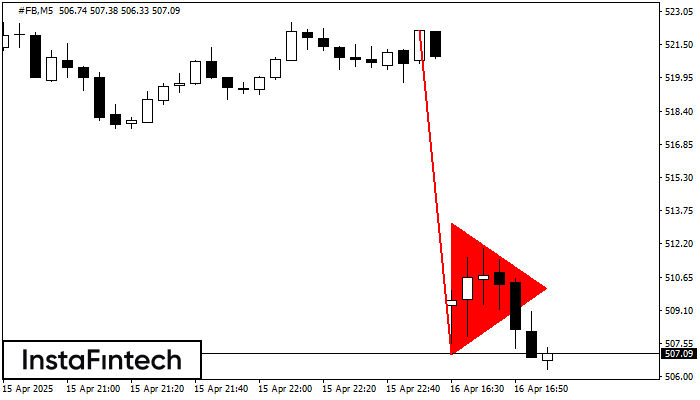
The Bearish pennant pattern has formed on the #FB M5 chart. The pattern signals continuation of the downtrend in case the pennant’s low of 507.03 is broken through. Recommendations: Place
The M5 and M15 time frames may have more false entry points.
Open chart in a new window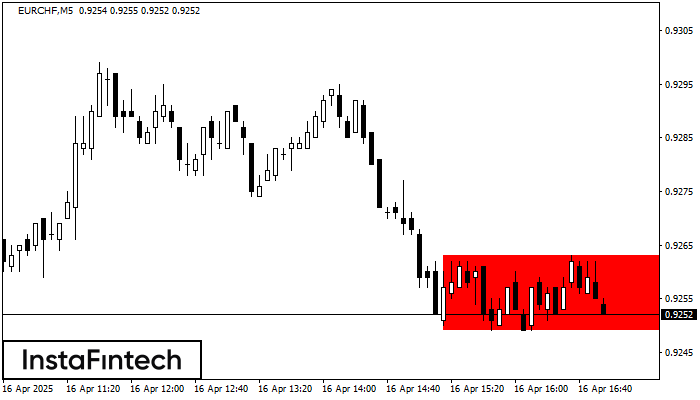
According to the chart of M5, EURCHF formed the Bearish Rectangle. This type of a pattern indicates a trend continuation. It consists of two levels: resistance 0.9263 - 0.0000
The M5 and M15 time frames may have more false entry points.
Open chart in a new window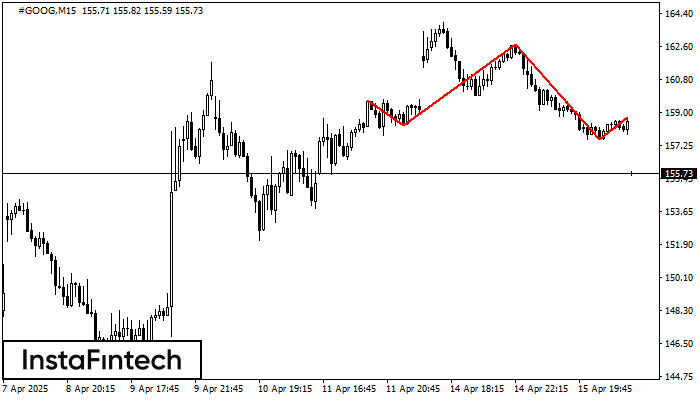
According to the chart of M15, #GOOG formed the Head and Shoulders pattern. The Head’s top is set at 162.70 while the median line of the Neck is found
The M5 and M15 time frames may have more false entry points.
Open chart in a new window