empty
20.01.2023 07:10 PM
Technical analysis of EUR/USD for January 20, 2023

This image is no longer relevant

Overview :

The expected trend for today: Bullish.

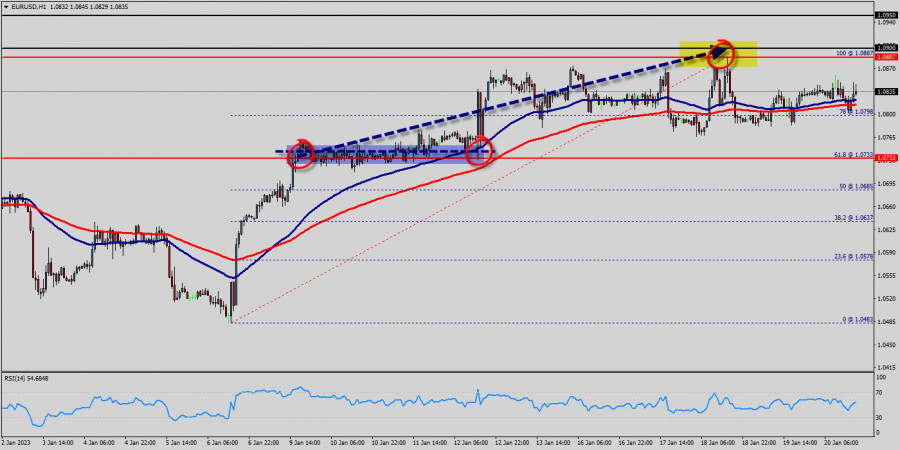
The EUR/USD pair rallied upwards strongly yesterday to breach the bearish channel's resistance and settles above it, opening the way to turn to the upside on the intraday and short-term basis, starting bullish correction for the raise measured from 1.0733 to 1.0835, noting that the first main station is located at 1.0887, which breaching it represents the key to achieve additional gains that reach 1.0900.

Therefore, the bullish bias will be suggested for today, supported by the EMA100 that carries the price from above, taking into consideration that breaking 1.0835 will stop the expected rise and push the price back to the main bearish track again.

A medium term topped could be in place already, on bullish convergence condition in daily RSI.

Intraday bias is now on the upside for 61.8% retracement of 1.0733 to 1.0835 at 1.0887. The EUR/USD pair traded higher and closed the day in the positive territory around 1.0835-1.0887.

On the hourly chart, EUR/USD is still trading above the moving average line MA (100) H1 (1.0835).

Accordingly, the bullish outlook remains the same as long as the EMA 100 is pointing to the uptrend. This suggests that the pair will probably go above the daily pivot point (1.0835) in the coming hours.

The EUR/USD pair will demonstrate strength following a breakout of the high at 1.0835 . The situation is similar on the four-hour chart. Based on the foregoing, it is probably worth sticking to the north direction in trading, and as long as the EUR/USD pair remains above MA100 H1, it may be necessary to look for entry points to buy for the formation of a correction. Probably, the main scenario is continued growth towards 1.0887 (Oct. 26 high). The expected trading range for today is between 1.0733 support and 1.0900 resistance.

Forecast:

Uptrend scenario :

An uptrend will start as soon, as the market rises above resistance level 1.0733, which will be followed by moving up to resistance level 1.0887. Further close above the high end may cause a rally towards 1.0887and 1.0900. Nonetheless, the weekly resistance level and zone should be considered at 1.0900.

Alternative scenario :

On the downside, break of 1.0733 major

support will turn intraday bias neutral first. The breakdown of 1.0733 will allow the pair to down further down to the prices of 1.0700 and 1.0685.

Pilih carta masa
5
min
15
min
30
min
1
jam
4
jam
1
hari
1
minggu
Jana pendapatan melalui perubahan kadar mata wang kripto dengan InstaForex.
Muat turun MetaTrader 4 dan buka dagangan pertama anda.
  • Grand Choice
    Contest by
    InstaForex
    InstaForex always strives to help you
    fulfill your biggest dreams.
    SERTAI PERADUAN

Artikel yang dicadangkan

Emas: Ketidakpastian Berterusan Terus Menyokong Harga Emas

Harga emas terus mendapat sokongan di tengah-tengah ketidakpastian yang menyelubungi hala tuju perang tarif yang dimulakan oleh Donald Trump. Harga emas telah meningkat hampir menegak selama empat bulan. Pendorong utama

Pati Gani 11:49 2025-04-17 UTC+2

Ramalan EUR/USD untuk 17 April 2025

Pada hari Rabu, euro sekali lagi bergerak ke dalam julat sasaran 1.1385–1.1420. Walau bagaimanapun, perilaku harga terbaru mencadangkan bahawa tahap 1.1385 kini tidak relevan — kami melihat julat pengukuhan antara

Laurie Bailey 11:07 2025-04-17 UTC+2

Ramalan USD/CAD untuk 17 April 2025

USD/CAD Pada carta harian, pengayun Marlin menunjukkan bahawa harga bersedia untuk potensi pembalikan ke atas. Di bawah masih ada tahap sasaran 1.3746 dan sempadan bawah saluran harga, yang secara hipotesisnya

Laurie Bailey 10:59 2025-04-17 UTC+2

Analisis Teknikal Pergerakan Harga Intraday Indeks Nasdaq 100, Khamis 17 April 2025.

Berdasarkan pemerhatian pada carta 4 jam indeks Nasdaq 100, terdapat beberapa perkara menarik, iaitu: pertama, pergerakan harga berada di bawah purata bergerak MA (100); kedua, kemunculan corak Segi Tiga (Triangle);

Arief Makmur 06:27 2025-04-17 UTC+2

Isyarat Dagangan untuk EMAS (XAU/USD) bagi 16-18 April, 2025: jual di bawah $3,320 (terlalu dibeli - 21 SMA)

Penunjuk eagle sedang mencapai tahap terlebih beli yang ekstrem. Oleh itu, pada paras harga semasa yang berada di bawah paras tertinggi sepanjang masa, adalah mungkin untuk menjual dengan sasaran pada

Dimitrios Zappas 18:20 2025-04-16 UTC+2

Analisis Teknikal Pergerakan Harga Harian Pasangan Mata Wang Komoditi USD/CAD, Rabu 16 April 2025.

Pada carta 4 jam, pasangan mata wang komoditi USD/CAD dapat dilihat bergerak di bawah EMA (100) dan kemunculan corak Bearish 123 serta kedudukan penunjuk Pengayun Stochastic yang sudah berada

Arief Makmur 07:37 2025-04-16 UTC+2

Analisis Teknikal Pergerakan Harga Intraday AUD/JPY Pasangan Mata Wang Bersilang, Rabu 16 April 2025.

Dengan keadaan Penunjuk Pengayun Stochastic menghampiri paras Terlebih Jual (20) pada carta 4 jam pasangan mata wang silang AUD/JPY, dalam masa terdekat AUD/JPY berpotensi untuk melemah ke kawasan paras 89.75–89.39

Arief Makmur 07:35 2025-04-16 UTC+2

Ramalan EUR/USD untuk 16 April 2025

Semalam, penunjuk sentimen ekonomi ZEW bagi zon euro untuk bulan April mencatatkan keputusan yang mengecewakan. Indeks tersebut menjunam daripada 39.8 pada Mac kepada -18.5, jauh lebih rendah berbanding ramalan pada

Laurie Bailey 05:12 2025-04-16 UTC+2

Ramalan GBP/USD untuk 16 April 2025

Pound British terus meningkat seperti yang dijangkakan dalam senario yang kami nyatakan sebelum ini (rujuk rujukan), menuju ke titik magnet di 1.3311, yang merupakan persilangan dengan sempadan atas saluran harga

Laurie Bailey 05:12 2025-04-16 UTC+2

Ramalan USD/JPY untuk 16 April, 2025

Pada carta harian, harga telah membentuk segitiga kecil di sekitar paras 143.45 dan kini berada dalam fasa pengukuhan di bawah paras tersebut. Memandangkan sasaran terdekat pada 141.70 sudah hampir dicapai

Laurie Bailey 05:12 2025-04-16 UTC+2
Tidak boleh bertanya sekarang?
Tanya soalan anda di Ruangan bersembang.
Panggilan semula Widget
 

Dear visitor,

Your IP address shows that you are currently located in the USA. If you are a resident of the United States, you are prohibited from using the services of InstaFintech Group including online trading, online transfers, deposit/withdrawal of funds, etc.

If you think you are seeing this message by mistake and your location is not the US, kindly proceed to the website. Otherwise, you must leave the website in order to comply with government restrictions.

Why does your IP address show your location as the USA?

  • - you are using a VPN provided by a hosting company based in the United States;
  • - your IP does not have proper WHOIS records;
  • - an error occurred in the WHOIS geolocation database.

Please confirm whether you are a US resident or not by clicking the relevant button below. If you choose the wrong option, being a US resident, you will not be able to open an account with InstaForex anyway.

We are sorry for any inconvenience caused by this message.