Traders need to have a grasp of the current market dynamics, recognizing when the market enters a period of consolidation (sideways movement) and when it signals a shift towards active trading.
Trading volumes serve as a valuable tool for this purpose as they reveal the behavior of other market participants. During consolidation phases, traders tend to accumulate positions, whereas during active trading phases, they distribute them.
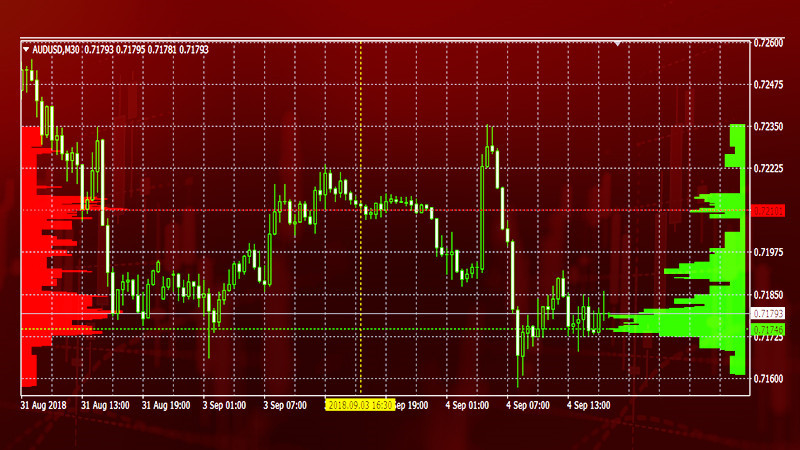
To identify and effectively utilize these market phases, traders can rely on volume indicators, particularly horizontal volumes, which are accessible through the volume MT4 platform.
In this article, we delve into a discussion of these volume indicators.
Trading volume
Trading volume provides insight into the number of trades executed for a specific asset within a selected time frame. This data helps gauge the overall interest of market participants in the asset.
A surge in trading activity signifies heightened trader engagement. High activity levels are indicative of a stable trend, whereas declining activity often precedes a period of consolidation or sideways movement in the market.
It's important to note that the calculation of trading volumes varies across different financial markets, reflecting the unique characteristics of each market. For instance, in the stock market, volumes are measured by the quantity of securities bought and sold. Exchanges compile and disseminate such data, making it accessible through specialized portals and websites.
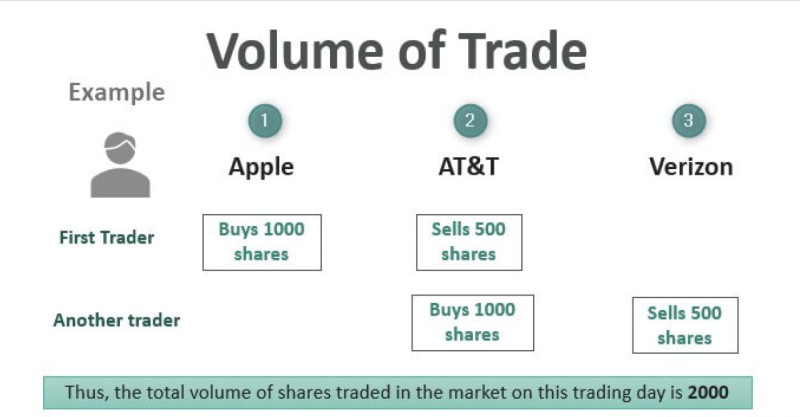
In the Forex market, there is no central exchange to meticulously record all transactions, making this indicator somewhat subjective. Nonetheless, its value lies in comparing current figures with past periods rather than focusing solely on absolute transaction numbers.
How is trading volume calculated? The method varies between stock and currency markets. In the stock market, an indicator known as "average volume" is utilized. It involves tallying the number of shares bought and sold during a trading day and then computing the average over a specified period, typically around 90 days.
In the Forex market, calculating trading volumes is more complex, so various methods are employed. One common approach is to determine tick volume, which reflects the frequency of price changes within a given time frame, rather than completed transactions.
Alternatively, traders can access data from specific brokers, which provide statistics on executed trades and calculate average volumes. While this data may not be precise in absolute terms, it remains valuable for tracking changes and trends in the indicator over time.
The use of trading volumes
Understanding and utilizing market volumes is a crucial aspect of trading. Traders often enhance their technical or chart analysis by incorporating volume indicators. These tools help in validating or refining trading signals.
Typically, volume indicators are not used in isolation. When combined with other indicators, they can be highly effective. This effectiveness stems from the correlation between price fluctuations and transaction volumes.
The direction of an asset's value is less important than the change in trading volumes. An increase in volumes generally signifies the movement's strength and suggests its likely continuation. Conversely, a decrease in volumes may indicate a weakening trend and the potential for a forthcoming shift.
In instances of sharp and significant price changes, it's essential to corroborate these movements with volume changes. Confirmed signals can justify opening a position in the direction of the movement. If the signals are not confirmed, it may be prudent to wait.
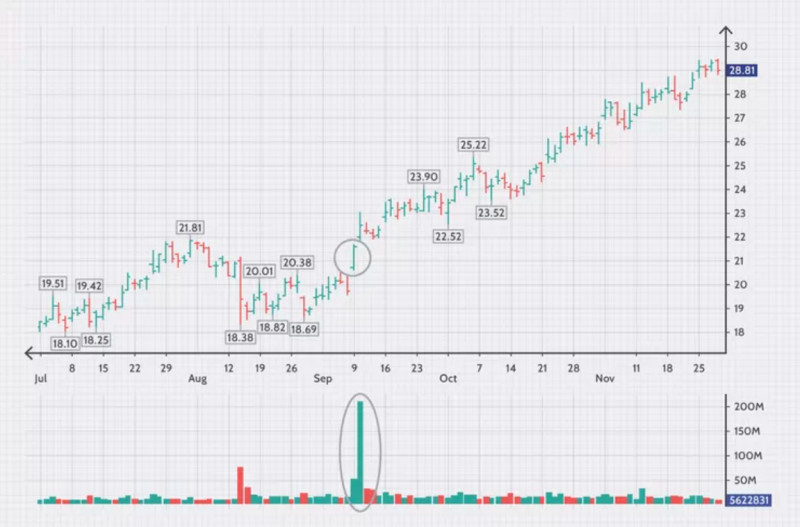
The application of volume tools is particularly relevant when the price moves outside its established range. A breakout from the channel's boundaries, coupled with a volume increase, validates the breakout's authenticity.
Entering a trade at the onset of a significant price movement can be highly advantageous, offering the potential for substantial profits. Volume indicators are especially valuable as they provide leading information, a distinct edge over other types of indicators.
These tools are highly effective when used alongside graphical or candlestick patterns. Certain patterns, such as "Head and Shoulders," "Triple Top," and "Hanged Man," clearly signal an impending trend reversal.
As these patterns emerge, specific "signal" points indicate where a trend shift may occur, presenting opportunities to initiate trades in the new direction. However, it's crucial to corroborate the pattern's formation with volume indicators before committing to a position.
Volume indicators
So, what tools can we use to gauge trading volumes? There are various categories of indicators that allow us to analyze this more comprehensively.
In terms of how they are displayed on the chart, we have two types:
- Horizontal volumes for volume MT4: These are represented as histograms with columns aligned parallel to the time axis. These indicators are directly overlaid on the chart and can identify significant levels.
- Vertical volumes: These charts feature bars arranged vertically and are typically positioned beneath the asset value chart. Each bar on the volume indicator chart corresponds to a candle on the value chart.
When it comes to the data source, we can differentiate between:
- Real data: This category relies on information obtained from official sources, specifically exchanges that meticulously record all transactions and make this data publicly available.
- Tick data: Calculations here are based on fluctuations in value per unit of time. This method is employed in the currency market, where centralized exchanges for transactions and statistics are lacking.
Let's delve deeper into which representatives of this category are frequently favored by traders in their trading activities. Some of these indicators come as standard features included in the basic volume MT4 terminal, while others can be downloaded separately.
One of the fundamental indicators within the trading platform is Volumes, which is positioned vertically beneath the main chart. The height of each bar on this indicator reflects the number of transactions executed during the formation of a single candle on the chart.
Consequently, a taller bar signifies a greater volume of transactions during that specific timeframe. Additionally, the color of the bar carries significance: red indicates a predominance of sellers, while green denotes a dominance of buyers.
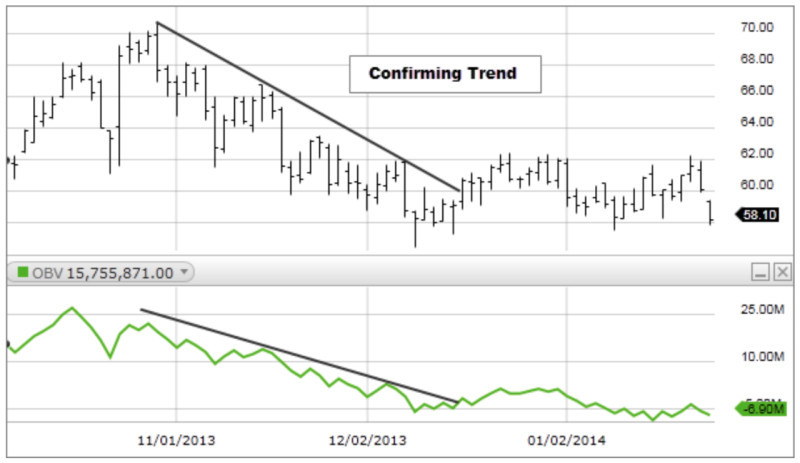
The On-balance Volume (OBV) factors in not only the trading volume itself, but also whether it is affected by upward or downward changes in value. This indicator is cumulative: when the value increases, the volume is added to the OBV, and when it decreases, it is subtracted.
Horizontal Volumes: Fundamental Concepts
In any financial market, there are two distinct phases that continually cycle: the equilibrium phase, also known as the accumulation period, and the momentum phase, referred to as the distribution period. During the initial phase, the value experiences minimal fluctuations.
The value satisfies both "bears" and "bulls," remaining relatively stable. During this period, prices tend to move within a narrow range. Consequently, volumes accumulate as traders await the initiation of a new trend.
Subsequently, a point is reached where the equilibrium is disrupted, marking the onset of the impulse phase, characterized by active trading. This surge in activity is instigated by major market players who identify the prevailing direction in which most trades are being initiated.
If the majority of private traders have entered into buy positions, significant players may drive the price downward, resulting in a bearish market trend. During this phase, values exhibit substantial fluctuations until a new equilibrium is established, thus ushering in another accumulation period.
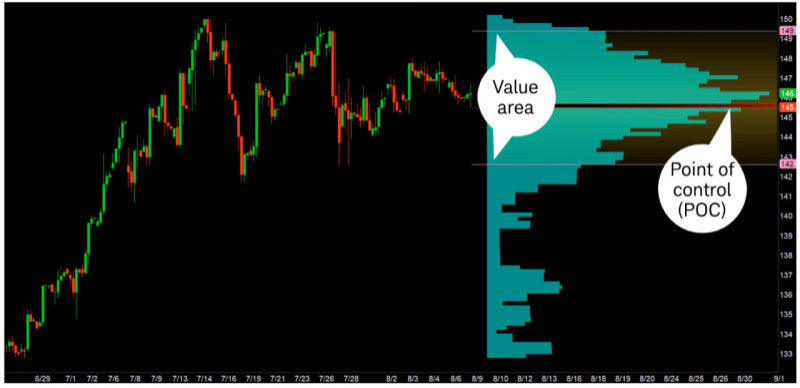
To effectively work with horizontal volumes, it is essential to grasp key concepts:
1. Value Zone: This represents the region where an asset's price is most objectively valued. Typically, it encompasses approximately 70% of the total transaction volume. Within this zone, there exists price equilibrium, making it suitable for most traders as positions accumulate.
2. Control Point: This denotes the most robust level within the value zone, where the cumulative volume reaches its peak. It is the lengthiest line on the histogram, signifying a significant concentration of trading activity.
3. Upper Value Boundary (VAH): The VAH serves as a useful indicator for identifying a resistance zone in the market.
4. Lower Value Boundary (VAL): Conversely, the VAL is a valuable tool for recognizing a support zone in the market.
Horizontal Volumes in MT4
As already mentioned, horizontal volumes are valuable indicators for pinpointing significant price levels on the chart. It's important to note that their placement may not necessarily align with local extrema.
Horizontal histograms come to our aid by showcasing the total volumes at each price level. Each bar on the histogram represents the quantity of contracts opened at that specific price point.
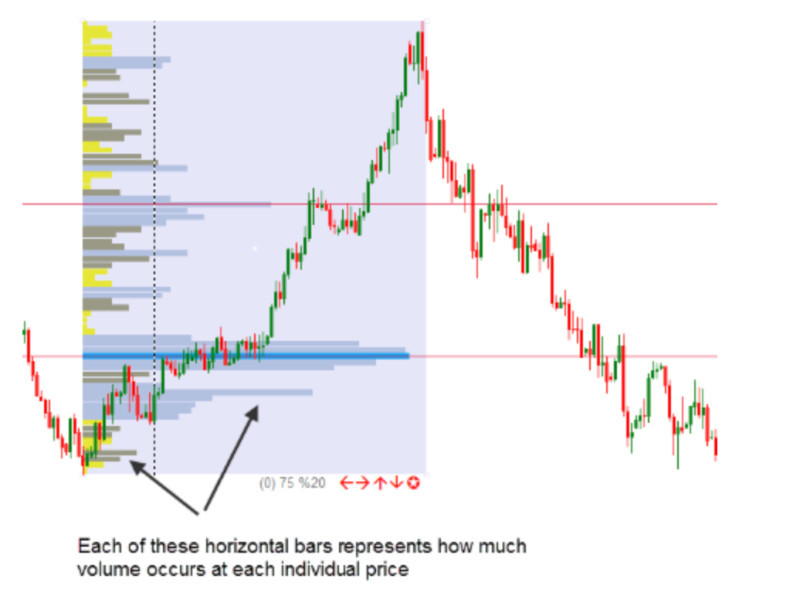
In this context, the actual numerical value itself holds limited importance. Horizontal volumes create levels that can serve as both support and resistance, offering valuable insights for traders.
Consider the highest level from the previous period as a reference point for the current one. A price fixation above this level hints at potential value growth, while falling below it suggests a decline.
This approach primarily aids in determining the most likely current trend direction, leaving the identification of precise entry points to other techniques. It excels at providing a directional overview.
For traders operating on shorter timeframes, horizontal levels become essential for breakout trading. Establish zones between the two most significant levels and capitalize on breakouts or retests.
Horizontal volumes shed light on the actions of major market players. Using this indicator, you can discern where positions are accumulating at particular price levels and how they're subsequently distributed.
Moreover, they enhance the accuracy of identifying support and resistance zones, enabling better placement of protective orders and facilitating optimal entry points for positions.
Trading with the use of Horizontal Volumes
We've already recognized the value of this tool. Now, let's delve deeper into how horizontal volume MT4 can be directly applied to the trading process.
To begin, it's essential to pinpoint the "Value Zone" on the histogram, which is easily identifiable as it holds the bulk of the trading volumes. Nevertheless, for precise price movement predictions, complementary tools may be employed.
Subsequently, determine the direction for opening trades, establish Stop Loss and Take Profit levels, and await the transition from the accumulation phase to the distribution phase.
Now, how can you identify the most opportune moments for initiating positions and ascertaining the trend's direction post-consolidation? There are various approaches, and traders can select the one that best suits their preferences.
For instance, candlestick patterns can serve as a reliable indicator. Certain patterns, such as "Bull Takeover," "Morning Star," "Three Soldiers," and others, unmistakably signal a shift towards an upward trend.
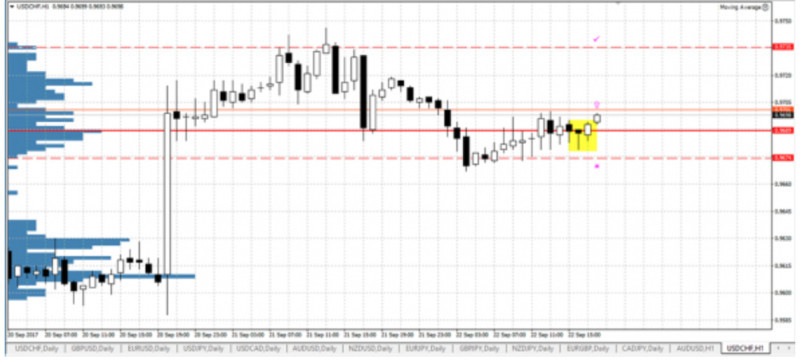
Following the formation of these chart combinations, and when the price becomes fixed above a notable horizontal level, it becomes opportune to initiate long positions. To safeguard these positions, set protective levels at the nearest local extrema marks to this point.
Similarly, opening short positions follows the formation of candlestick combinations indicating a shift in the trend downward, such as "Bearish Takeover," "Hanged Man," "Three Crows," and so forth. Once such a pattern materializes, and the price is confirmed below a significant level, a short trade can be executed.
Furthermore, vertical volumes can be effectively combined with horizontal volumes to enhance the precision of position entry points. The vertical volumes chart is situated beneath the primary price chart and mirrors its movements.
As the market's consolidation phase concludes, and a breakthrough in one direction is anticipated, trading volumes undergo a notable surge. This surge serves as confirmation that the chosen entry point is well-founded.
Guidelines for using Horizontal Volumes
When employing Horizontal Volume MT4, a trader's skills and experience are pivotal. However, this section compiles a set of recommendations for effectively harnessing this indicator.
1. Supplementary Tool: Consider Horizontal Volumes as a supplementary tool. Use it to confirm or filter signals from other indicators in your trading strategy.
2. Leading Indicator: Unlike many other indicators, volume indicators are leading indicators. Leverage this aspect to identify optimal market entry points for more profitable trades.
3. Free Indicator Functionality: Trading terminals often include free versions of indicators that are highly functional and capable of fulfilling their intended purposes. There may be no need to purchase paid tools.
4. Align with Dominant Trend: It's advisable to execute trades in alignment with the prevailing trend. Enter positions when histogram signals align with the dominant trend, especially on higher timeframes.
5. Big Player Insights: Utilize horizontal volumes to gain insights into the behavior of major market players. This tool reveals where significant volumes accumulate and how positions are distributed.
6. Enhanced Support and Resistance: Enhance your support and resistance level plotting by employing the volume histogram. Additionally, use it to forecast future price movements.
Remember that this indicator is not well-suited for pinpointing immediate entry points. Instead, its utility lies in achieving the following objectives.
Conclusion
In this article, we have explored an essential yet often overlooked tool for every trader – horizontal volume MT4. This tool provides valuable insights into the market's condition and its potential future movements.
While these indicators are typically seen as supplementary and are seldom used in isolation, they serve a crucial role in confirming or refining signals from other trading tools. Volume indicators complement chart or candlestick patterns exceptionally well.
By incorporating patterns, traders can discern the optimal direction for position entry based on the type of pattern formed, whether signaling an upward or downward trend. Simultaneously, volume indicators aid in pinpointing precise entry points.
Horizontal volumes are instrumental in establishing the market profile and understanding the behavior of prominent traders. They effortlessly lead you to identify the "Value Zone," where the majority of transactions cluster.
Furthermore, this indicator offers enhanced precision in defining support and resistance zones and setting protective levels. You can enhance your trading strategy by synergizing its insights with signals from vertical volume indicators.
You may also like:
How to install an indicator in MT4
How to add expert advisor in MT4
How to install two MT4 terminals


 Back to articles

