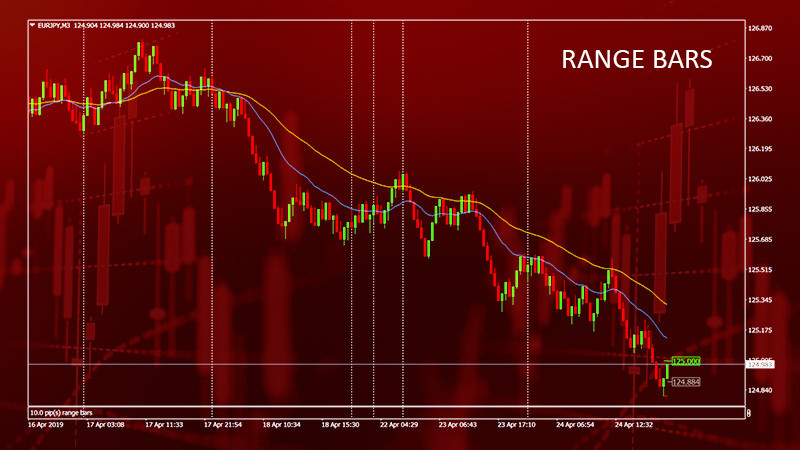
In the market, it is believed that only 20% of the time accounts for periods of active movement, while the remaining 80% are periods of consolidation or sideways movement. Trading is possible in both scenarios, but each has its nuances.
In addition, during sideways movement, a large number of false signals can occur. To eliminate them and obtain more reliable information about price fluctuations, special tools can be used. One such tool is the range bars MT4, which we will examine in more detail in this article.
Trend vs flat
Market movements can be either positive, with the value of an asset increasing, or negative, with its value decreasing. When the market exhibits a directional movement, it's called a trend, or a dominant tendency. However, active trend movements cannot always occur in the markets.
After powerful impulsive movements, there often comes a time of "calm" when the price does not experience sharp fluctuations but rather moves within a certain channel or range. This type of movement is known as sideways, or flat movement. This range is limited by two lines: the lower boundary is the support level, and the upper boundary is the resistance level.
There are many reasons for the emergence of sideways movement such as:
- balance between supply and demand,
- reduced trading volumes,
- anticipation of important economic and financial news,
- low demand, and reduced asset liquidity.
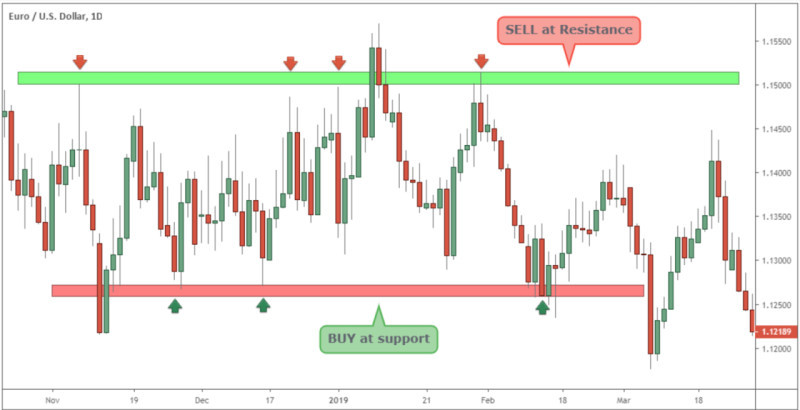
These periods can also be used for trading, but it's essential to trade within the range. The simplest method is "bounce trading," where trades are opened upon the graph touching one of the range's boundaries in the direction of the bounce.
Notably, after such periods of flat movement, the most active and powerful price surges are often observed. Strategies for "breakout" trading at one of the corridor boundaries exist for such situations.
Trend algorithms "break" during intra-channel price movements, leading to many false signals from technical indicators during these periods.
Additionally, another tricky feature of a flat is that it is quite difficult to predict where the price will head after it ends. It might continue in the direction of the previous trend or move in the opposite direction.
Interaction of Price and Time
We are accustomed to seeing charts with two main dimensions: the time axis (horizontal) and the price change axis (vertical).
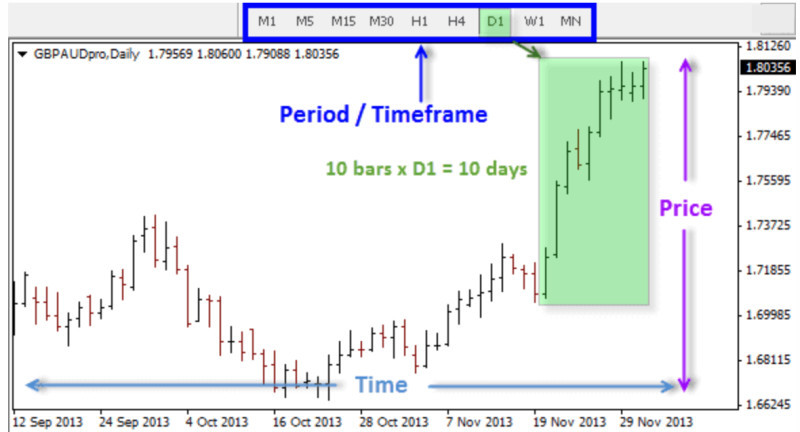
We can see how the price changes over time, forming a line that is sometimes smoother and sometimes shows more abrupt changes.
There are familiar types of charts to all traders: line charts, bar charts, and Japanese candlestick charts. Among these, the line chart is the simplest, while the other two have a more complex construction mechanism.
A line chart is built using points, each representing the closing price at a given time. Bar and candlestick charts consider more parameters: open and close prices, as well as lows and highs.
Despite their differences, they share one important feature: each element, whether a point or a candle, is plotted on the chart after a certain period.
For example, on an M15 time frame chart, a new candle is drawn every 15 minutes, on an H1 time frame – every hour, and on a D1 time frame – every day. This happens regardless of whether there have been any price changes during that time.
In periods of trending movement, each subsequent column is placed higher or lower than the previous one, whereas, in periods of sideways movement, they hardly differ from each other. Traders call this "price noise."
Over a sufficiently long time, a monotonous picture may be observed. Let's talk about whether it's possible to change this and get a picture that reflects actual changes in price.
Eliminating Time Factor
From the previous section, we have already understood how charts are constructed in their conventional representation. Regardless of the chosen type, they ultimately show us the same thing.
However, if we want to see a different variant of displaying price changes, we need to use other tools. One such tool is range bars MT4.
Its key feature is the actual elimination of the time factor. This tool also uses bars or candles to construct the chart, but the mechanism of their application is different.
In this case, each candle is drawn only at the moment when there is a real price movement. This means that if the price does not change throughout the day, the tool does not draw new columns.
At the same time, during periods of strong volatility, when the price can change every minute, new columns will appear on the chart every minute. This makes the price chart more dynamic and reflects real price changes.
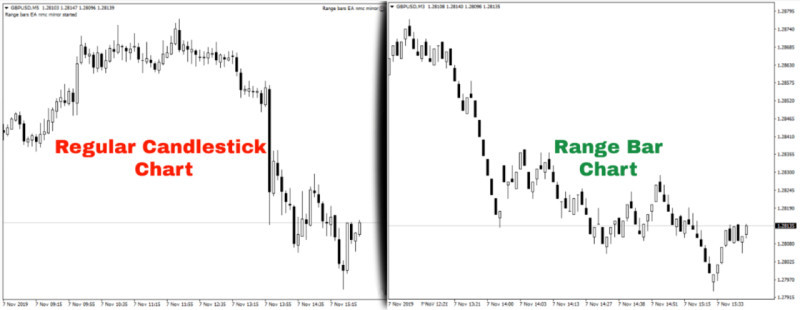
This type of chart falls under tick charts, as they react specifically to price fluctuations, i.e., ticks. Each candlestick on the chart represents a change in price by a certain number of points.
This value is calculated as the difference between the high and low price values. As soon as this difference reaches the value set by the user, a new column starts being drawn on the chart immediately.
For example, if a value of 25 points is set for the euro/dollar pair, and its initial rate was 1.1100, then a new column will not form until the price reaches 1.1125. When the pair reaches this mark, the previous candlestick closes and a new one begins to be drawn with an opening price of 1.1125.
Range Bars MT4 Installation
The indicator in question is not built into the main panel of the MT4 platform. However, it is quite simple to install, configure, and use for trading on this platform.
This indicator can be downloaded from other sources to your computer. After downloading, the file needs to be copied into the trading terminal. Also, before installing, it is necessary to immediately select the asset that will be used for trading.
Once the installation has been completed, you can open a separate window with a chart that will be constructed using range bars. Another important step for the indicator's operation is its configuration.
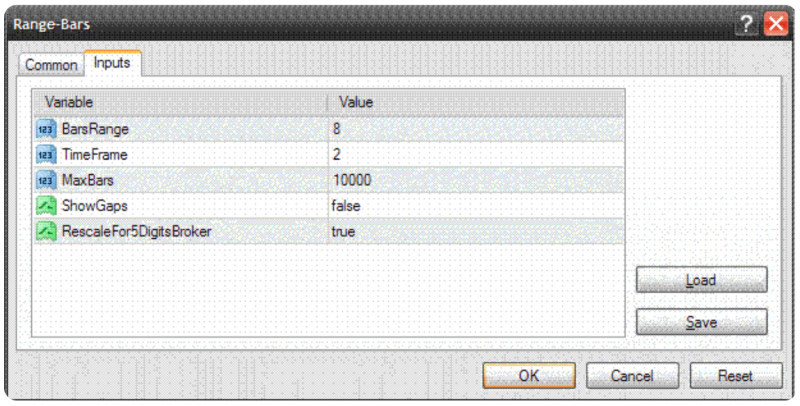
The main parameter that can be configured is "PipRange," that is, the number of points the price must move to form each column. By default, the program has a value of 13 points, but it can be changed.
There is another parameter that can be adjusted – "TimeFrame." Although this indicator excludes the time factor, there are cases when it can be used.
Such cases are when several charts of the same currency pair are used simultaneously but with different "PipRange" settings. For example, one chart with a period of 10 points and another with 15. In such a situation, a value of 2 is set in the "TimeFrame" field for one chart and 3 for another.
Additionally, there are settings through which other parameters can be adjusted. For example, it is possible to turn sound notifications on and off and choose to display the chart in the form of bars or candlesticks.
Trading Strategies
Thanks to the use of the discussed tool, traders get a chart with all columns of equal size, tailored to the needs of each specific user.
A chart built using range bars MT4 allows for more precise identification of support and resistance zones, as well as points for opening and closing positions. Let's illustrate this with a specific example.
Before starting to make trades, it is necessary to identify support and resistance on the chart. To do this, select a step size of 5 points for forming the columns on the chart.
The resistance level is tracked on the chart. After identifying it, one must wait for the price to test it and for the fourth candle to close toward the current trend. At this point, a short trade is opened.
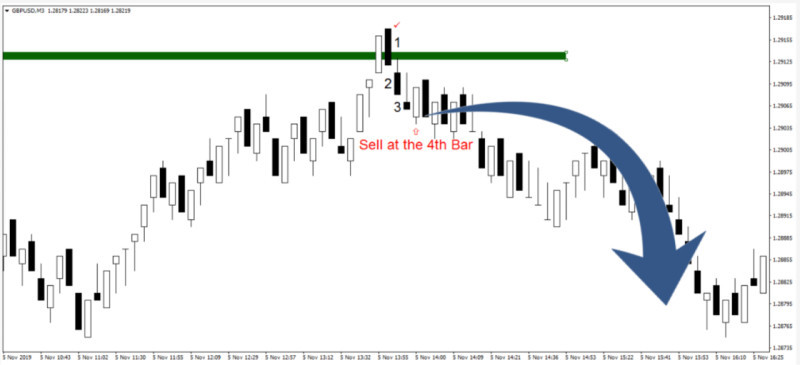
There are other trading options. Another variation of the trading strategy is the "F4 Pattern," where a trade is opened during a small price pullback and assumes the continuation of the dominant trend.
It is also possible to supplement the range bars chart with other indicators that will provide signals for opening positions. Among technical indicators, moving averages are most commonly used in this algorithm.
Two moving averages need to be applied to the chart: one simple and one exponential with periods of 12, and the MACD is used for filtering signals. The crossing of the SMA and EMA, and the closure of the next range bar below or above the point of their intersection, is used as a signal for opening a position.
Conclusion
In this article, we have explored one of the interesting tools that traders can use to display charts – range bars MT4. By using this indicator, it is possible to eliminate the time factor and work only with real price changes.
In the standard form, candlesticks or bars are plotted on the chart after a certain period, regardless of whether there was any price change during that time. For example, if the M1 timeframe is selected, this happens every minute; if M15, every 15 minutes; if H1, every hour.
Thus, sometimes we observe a large number of columns at approximately the same level on the charts, as the price does not make any significant changes during a period when the market experiences sideways movement.
When using range bars, columns on the chart are not plotted after a certain period (like every 5 minutes or hour) but only when the price moves a certain number of points.
This value is set by the user and allows tracking only price changes, regardless of how often they occur – within a few seconds or several days.
Here, each column carries precise information about the change in price by a set number of points. This allows seeing the chart without periods of sideways movement when the price hardly changes. Range bars simply will not form during such periods.
Such display of charts is quite popular among traders and is used in several trading strategies. It is possible to use only the Range Bars themselves to get signals or also auxiliary tools at the user's discretion.
You may also like:
How to install an indicator in MT4
How to add expert advisor in MT4
How to install two MT4 terminals


 Back to articles

