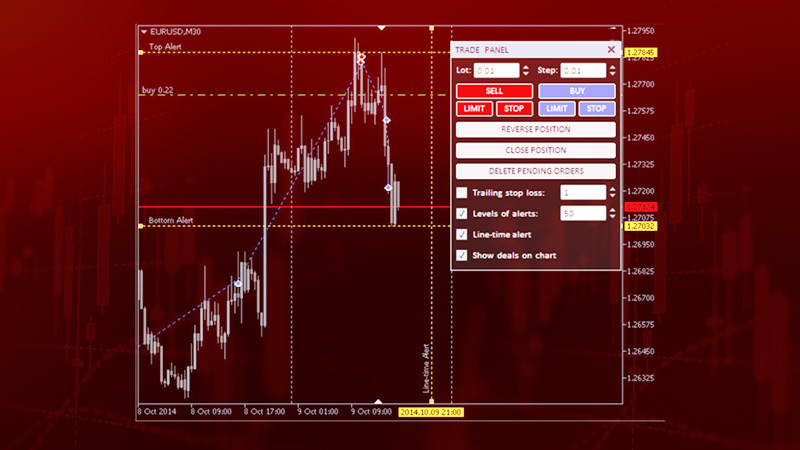
To execute profitable trades, a speculator needs a good trading strategy, but this is not the only factor. Some prior actions and the process of opening positions are also of great importance.
By preparation, we basically mean conducting market analysis and recognizing entry points. This can be done in various ways and with different tools, depending on the preferred strategy.
In this article, we will discuss how to manage trades and open positions on the trading panel MT4, and how to ensure the ultimate optimization and automation of this process.
Technical chart and its types
A chart is a visual representation of the change in the value of a trading instrument over a certain period. It is the most illustrative way to track price movements.
Various types of analysis are also conducted with the help of charts. Graphical analysis, or Price Action, involves searching for specific patterns formed by the price fluctuations themselves. Technical analysis uses indicators to analyze the market.
Every chart has two axes: the vertical axis displays market quotes and the horizontal axis shows time. A timeframe can also be set for the chart, which is the period after which new bars or candles are drawn (1 minute, 15 minutes, 1 hour, etc.).
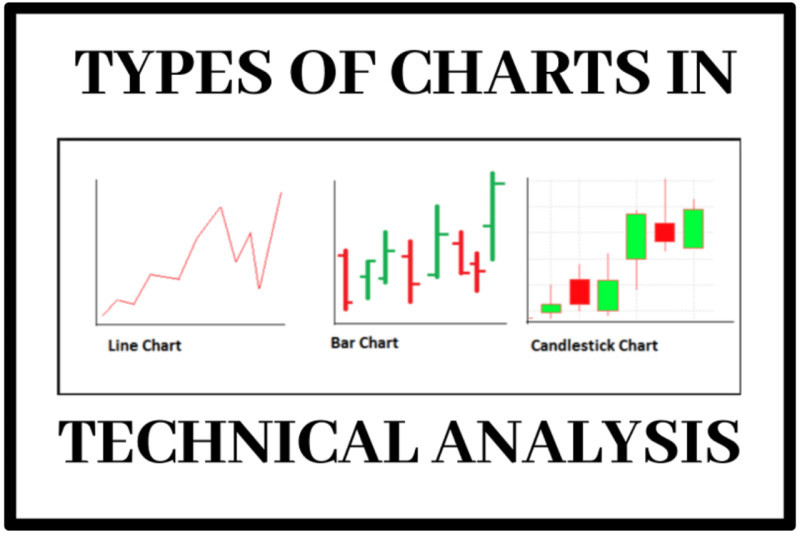
There are three main types of charts:
- A linear chart consists of a single line drawn by connecting points. Each point corresponds to the closing price for a given interval. Its advantage lies in its simplicity and conciseness, showing only the closing prices.
- A bar chart has a more complex display, as each bar includes opening and closing prices, as well as the highest and lowest values for any time interval.
- A Japanese candlestick chart is plotted according to the similar principle as the above. The difference is that fluctuations are displayed in the form of candles. This chart allows for a special type of analysis – candlestick analysis, which is based on combinations of Japanese candles.
Each type of chart has its advantages and disadvantages and can be used depending on the goals and objectives of the trader. For example, the linear chart, being the most minimalistic, can be used in cases where a user needs to apply several technical indicators.
Based on the bar chart, one can track market volatility, whereas the candlestick chart can be used directly for decision-making. This is because certain types of candles or their combinations can indicate a trend change and serve as indicators for entering a position.
Chart elements
So, we have already found out that each chart has two main scales – the time scale and the quote scale. In the column with the price range, the current value of the asset is separately highlighted: in green if the price is rising, and in red if it is falling.
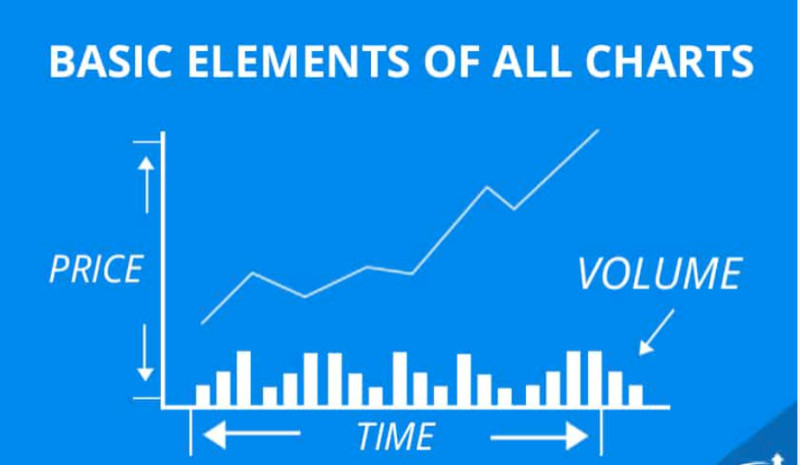
This value constantly changes, and accordingly, its color changes as well. The time scale marks the periods for which you can see the quotes. When clicking on any candle, its price and the date of that quote will be displayed.
We have already talked about the timeframe of charts. Depending on the set value of this parameter, new elements, dots or candles, will appear on it at specified intervals. This will happen regardless of whether the price of the asset has changed during this time.
Depending on the trading strategy used, users can choose different timeframes. Typically, low or short time intervals (M1, M5, M15) are used for short-term strategies, while higher ones (from H4 and above) are used for long-term strategies.
Additionally, technical indicators can be applied to the chart. Each has its own display and function: some are designed to determine the trend, others meant for trading volumes, and so on.
Currency rate changes are measured in points or pips – this is the standard unit of price fluctuation. One point is equal to 0.0001 USD (for currency pairs including the US dollar), i.e., 1/100 of a percentage point.
Typically, the price is displayed with 4 decimal places, for example, 1.5436. However, in some cases, more or fewer digits may be displayed, depending on the specific asset.
How to read charts
As mentioned earlier, charts carry a mine of information. The key is to be able to read them correctly and extract the necessary information. Oftentimes, no extra tools are required for this, just the chart itself.
The display of the chart matters for what specific data a trader wants to obtain. As already mentioned, a linear chart is a simple line that can be used to track the overall market sentiment and the prevailing trend.
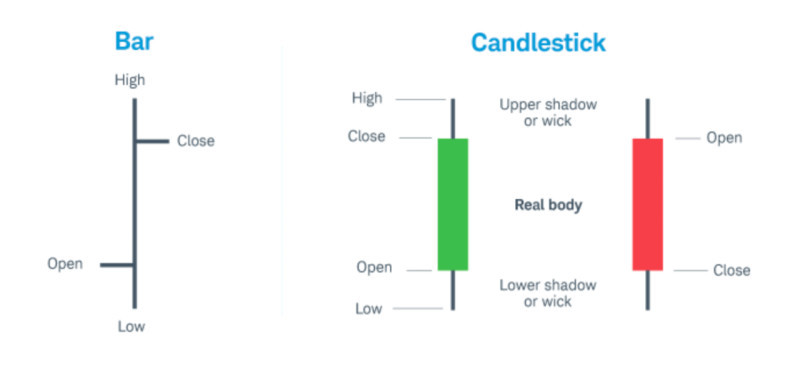
A Japanese candlestick chart carries much more data as each candle reflects not only the closing prices but also other price parameters for a given time period. Additionally, the chosen timeframe matters: more candles will be drawn on lower timeframes, while fewer on higher ones.
An important aspect is that charts reflect real-time changes in quotes, meaning what is happening in the market right now. Market quotes change not only over time but also relative to each other.
However, this is not all that a chart can show. One can look at historical data and get information about price changes for almost any period: the last month, year, 10 years, and so on.
Such information is necessary for conducting market analysis and making forecasts of future price movements. After all, most traders believe that the market is cyclical and that movements tend to repeat themselves.
How to grasp trading signals
The primary goal of any trader is to execute successful transactions and earn profits. For this, the MT4 trading panel is designed. First and foremost, a trader has to grasp the signal to open a position.
Signals are recommendations regarding the best moment to open a long or short trade. Users employ all possible tools to receive such signals.
These can be signals appearing on the chart itself: combinations of candles, graphical patterns, or obtained using special indicators.
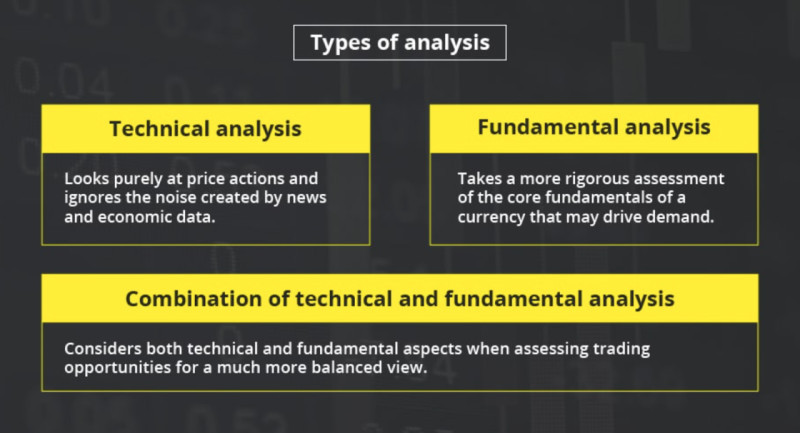
Depending on the method of market analysis, several main types can be identified.
- Price Action implies readings from the chart itself without applying any additional tools. Candlestick combinations and graphical patterns fall under this category: a trade is opened at the moment when a particular pattern shows up.
- Technical analysis uses auxiliary tools called indicators. They are applied to the chart. A trader makes the decision to enter the market when specific conditions of interaction between the indicators themselves or with the chart are met.
- Fundamental analysis is based on the examination of economic and financial news, obtained from the economic calendar. According to this method, the publication of key financial and economic news influences price changes, hence they serve as signals.
In practice, traders often use not just one method of analysis but a combination of several. This way enables a more accurate assessment of the market situation. So, a trader makes a prudent decision.
In addition to independent analysis, there are other ways to receive signals for opening positions. For example, purchasing signals from more experienced users – signal providers.
How to manage trades on trading panel MT4
Before moving to the faster method of executing trades, which is the MT4 trading platform, let's discuss the classic ways of opening positions on the trading platform.
To conduct trades in the MetaTrader platform, there is a special Order tab. Clicking on this button brings up a table with the main parameters that the user needs to set. Let's look more closely at what these parameters are and how to set them.
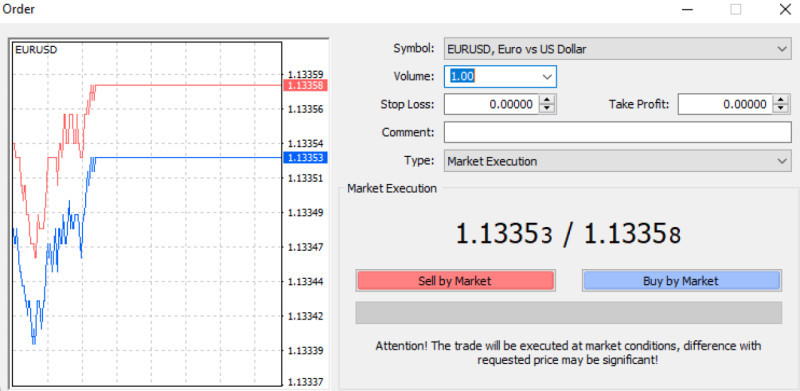
- Lot Size. This is the unit size that the user determines for a single trade.
- Stop Loss and Take Profit. These are orders for automatically closing positions when the price reaches the values set by the user.
- Order Execution Type:
- Market Execution. The order is executed instantly, right after it is placed.
- Pending Orders. These are requests to open positions when the price reaches the level specified by the user.
Pending orders are further divided into several categories: limit or stop orders. The following types are distinguished:
4. Buy Limit is an order to buy an asset at the best price. This price is set below the current level, and the program will not even allow setting this type of order above the market price.
5. Buy Stop is used when a trader wishes to buy an asset at a price higher than the market price. It seems that such an order makes no sense, but it can be used to determine the end of a downward trend and a reversal of the price towards an increase.
6. Sell Limit is an order to sell at a higher price than the market price. Here everything is clear: every trader wants to sell the asset as expensively as possible.
7. Sell Stop is used when a trader wants to sell an asset at a lower price than the market price. Such an order is placed to find the entry point at the very beginning of the formation of a downward trend in the market.
MT4 interface
In the previous sections, we explored how the trading process is implemented through setting market and limit orders. However, in the context of short-term strategies, traders often have only seconds to execute a trade.
In such situations, the time required to open a separate window and set all parameters can work against the trader. That's why the trading panel was invented to save this precious time.
Its key feature is that it is located directly on the chart. This allows for quick response to signals and opening positions with practically a single click.
Trading panels are designed in various types and can differ from each other visually or functionally. However, they all perform the same basic task – simplifying and speeding up the trading process.
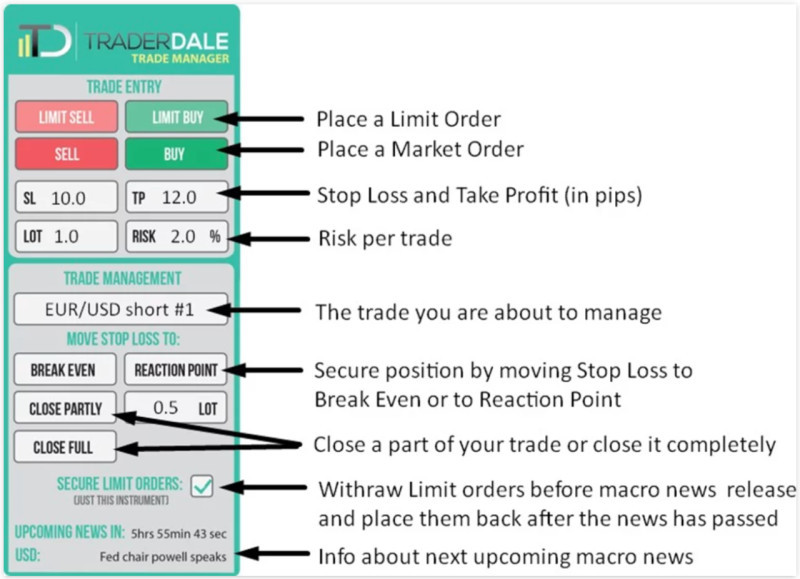
Similar to the Order tab, which we discussed in the previous section, the trading panel has several buttons and parameters that can be configured. The main buttons are Buy and Sell, used to open positions.
To make everything as quick as possible, some other parameters need to be preset on the panel. For example, setting the SL and TP orders, the degree of risk (in percentage), selecting the order type, and also the type of closure (full/partial).
Thanks to the built-in risk management, traders can immediately see the amount they will gain if the trade closes at TP, or lose if it closes at SL. Moreover, it's also possible to see how the risk-reward ratio changes as these values are moved.
Furthermore, trading panels allow for other actions. For instance, they have quick access buttons that can be used to change the position's direction, close a trade, or delete all pending orders.
One-click trading
For traders who prefer the shortest-term types of trading, such as scalping, it's not necessary to have all the options offered by the trading panel MT4 at their disposal.
What's crucial for them is the speed of executing trades. Therefore, trading platforms include a feature like One-Click Trading for such cases: an integrated function of the MT4 and MT5 platforms.
When using this function, a small interface is placed on the chart, containing much less information than the interfaces we discussed earlier.
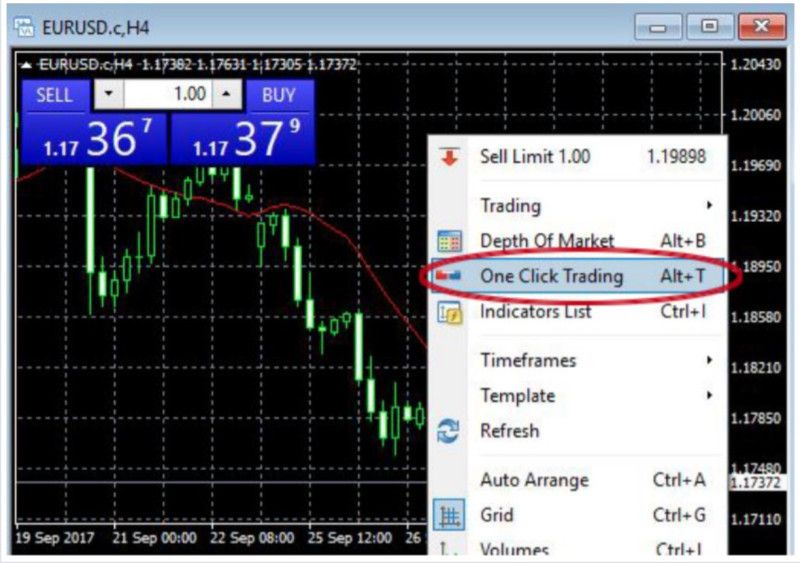
It displays only two values: the Ask and Bid prices, i.e., for buying and selling, and has only two buttons: Buy and Sell. It's also possible to specify the lot size, which is done before pressing one of the aforementioned buttons.
As soon as a signal to open a position arises, the user only needs to specify the volume of the position and click the button. While using the standard method of opening positions through the Order tab typically takes 30-40 seconds, in this case, it takes literally 1 second.
For scalpers, every second and every point matter, as their earnings consist of a large number of short trades of small volume. The price of the most popular currency pairs can change every second, so it's necessary to quickly profit from these fluctuations.
Moreover, in short-term trading, setting protective orders is not relevant, as trades are opened for just a few seconds or minutes. Consequently, there is no sense in losing time setting these parameters, and they are not included in the interface under consideration.
Conclusion
In this article, you have introduced to you a tool that significantly simplifies and accelerates the trading process: the trading panel MT4. Such interfaces are available in various versions but are similar in functionality.
This tool is particularly relevant for traders who prefer short-term trading, especially scalping. Oftentimes, they have only seconds to open a position.
In a typical situation, for these purposes, the trading platform has a special tab where all necessary parameters can be set. After setting the values of all the main parameters, a trader can place an order, which can be either a market or a pending order.
A market order implies immediate execution, while a pending order activates when the price reaches a user-defined level. These levels can be either above or below the current price, depending on the trader's goals.
Trading interfaces are located directly on the main chart. Therefore, they allow performing all necessary actions without being distracted from market activities, significantly saving precious time.
Nevertheless, using trading panels does not exempt from preliminary preparation, which includes conducting a market situation analysis and finding entry points.
Market analysis can be conducted in several ways, the main ones being technical, Price Action, and fundamental analysis. Users often apply combinations of these methods to receive signals.
You may also like:
How to install an indicator in MT4
How to add expert advisor in MT4
How to install two MT4 terminals


 Back to articles

