сила сигнала 2 из 5
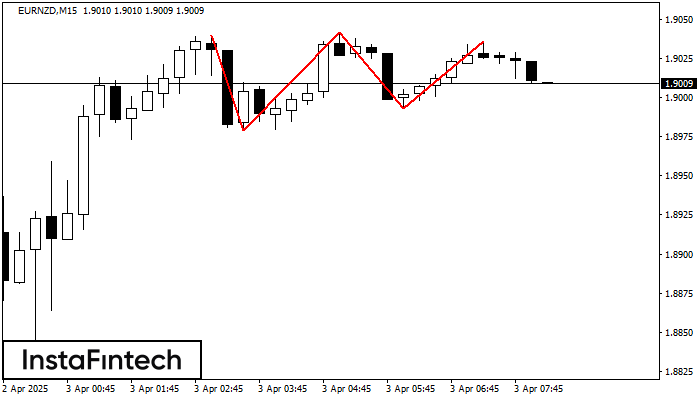
На графике EURNZD M15 образовалась фигура «Тройная вершина». Данная фигура относится к типу разворотных и имеет характеристику: Верхняя граница 1.9040/1.9036; Нижняя граница 1.8979/1.8993; Ширина фигуры 49 пунктов. Прогноз: В случае пробоя нижней границы 1.8979 вероятно дальнейшее нисходящее движение к уровню 1.9020.
Таймфреймы М5 и М15 могут иметь больше ложных точек входа.
Смотрите также
- Все
- Вымпел
- Голова и плечи
- Двойная вершина
- Прямоугольник
- Треугольник
- Тройная вершина
- Флаг
- Все
- #AAPL
- #AMZN
- #Bitcoin
- #EBAY
- #FB
- #GOOG
- #INTC
- #KO
- #MA
- #MCD
- #MSFT
- #NTDOY
- #PEP
- #TSLA
- #TWTR
- AUDCAD
- AUDCHF
- AUDJPY
- AUDUSD
- EURCAD
- EURCHF
- EURGBP
- EURJPY
- EURNZD
- EURRUB
- EURUSD
- GBPAUD
- GBPCHF
- GBPJPY
- GBPUSD
- GOLD
- NZDCAD
- NZDCHF
- NZDJPY
- NZDUSD
- SILVER
- USDCAD
- USDCHF
- USDJPY
- USDRUB
- Все
- M5
- M15
- M30
- H1
- D1
- Все
- Покупка
- Продажа
- Все
- 1
- 2
- 3
- 4
- 5
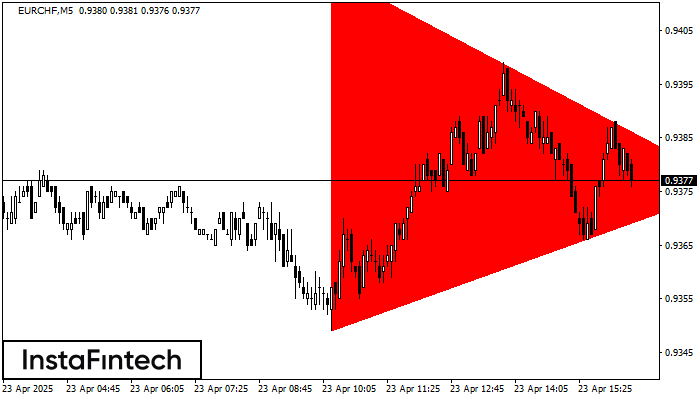
According to the chart of M5, EURCHF formed the Bearish Symmetrical Triangle pattern. Description: The lower border is 0.9349/0.9376 and upper border is 0.9416/0.9376. The pattern width is measured
The M5 and M15 time frames may have more false entry points.
Open chart in a new window
The Double Bottom pattern has been formed on #FB D1. Characteristics: the support level 482.05; the resistance level 587.72; the width of the pattern 10567 points. If the resistance level
Open chart in a new window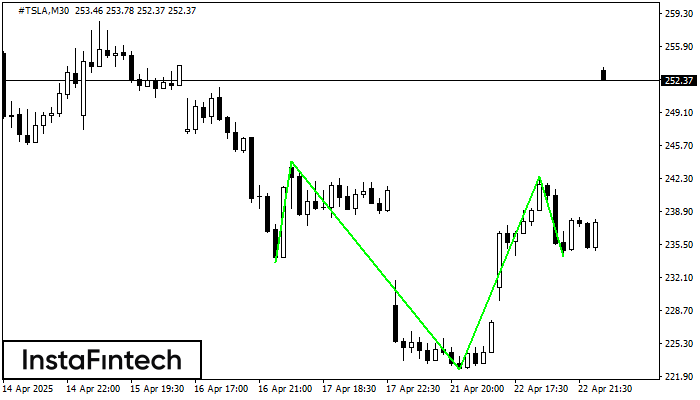
According to M30, #TSLA is shaping the technical pattern – the Inverse Head and Shoulder. In case the Neckline 244.08/242.52 is broken out, the instrument is likely to move toward
Open chart in a new window