empty
08.07.2022 06:00 PM
USD/JPY: further growth favored

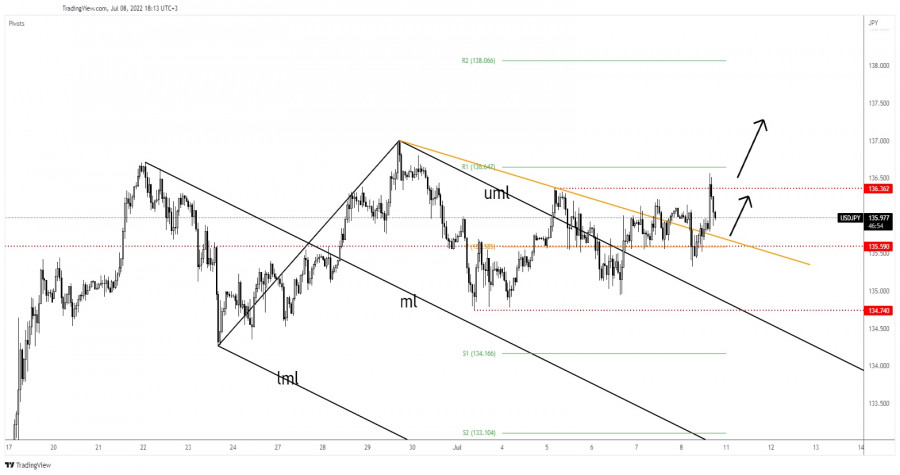
The USD/JPY pair climbed as much as 136.56 today and has found resistance. Now, it is traded at 136.10 at the time of writing. As you already know from my previous analysis, the trading instrument maintains a bullish bias, so further growth is still ahead.

Today, the Japanese data came in mixed. The Current Account was reported at 0.01T below 0.16T expected, the Economy Watchers Sentiment dropped from 54.0 to 52.9 points, Bank Lending rose by 1.3% exceeding the 0.9% growth expected, while Household Spending dropped by 0.5% even if the specialists expected a 2.2% growth.

On the other hand, the USD received a helping hand from the US data. The NFP came in at 372K in June versus 260K expected, while the Average Hourly Earnings and the Unemployment Rate came in as expected.

USD/JPY Retests The Buyers!

This image is no longer relevant

My previous analysis told you that USD/JPY could jump towards new highs. It has managed to stabilize above the broken downtrend line signaling strong buyers. The upside momentum was stopped by the 136.36 former high which stands as static resistance.

In the short term, the price could come back to test and retest the downtrend line and 135.59. Failing to reach and retest these levels may signal strong upside pressure.

USD/JPY Outlook!

A valid breakout above 136.36 may signal further growth. A new higher high, jumping and closing above 136.56 could bring new buying opportunities as the USD/JPY pair could approach and reach fresh new highs.

Ralph Shedler,
InstaForex के विश्लेषणात्मक विशेषज्ञ
© 2007-2025
समय सीमा चुनें
5
मिनट
15
मिनट
30
मिनट
1
घंटा
4
घंटे
1
दिन
1
सप्ताह
Earn on cryptocurrency rate changes with InstaForex
Download MetaTrader 4 and open your first trade
  • Grand Choice
    Contest by
    InstaForex
    InstaForex always strives to help you
    fulfill your biggest dreams.
    कॉन्टेस्ट में हिस्सा लें

अनुशंसित लेख

#NDX – तकनीकी विश्लेषण अवलोकन

मासिक शॉर्ट-टर्म ट्रेंड स्तर (19730) पर रुकावट के कारण बुल्स ने अपनी स्थिति पुनः प्राप्त करने की कोशिश की। इसके परिणामस्वरूप, नए ट्रेडिंग सप्ताह की शुरुआत में एक बुलिश गैप

Evangelos Poulakis 08:10 2025-03-27 UTC+2

AUD/JPY क्रॉस करेंसी जोड़े के इंट्राडे मूल्य आंदोलन का तकनीकी विश्लेषण, बुधवार 26 मार्च, 2025।

यह 4 घंटे के चार्ट पर देखा जा सकता है कि AUD/JPY क्रॉस करेंसी जोड़ी एक बुलिश चैनल में सामंजस्यपूर्ण रूप से आगे बढ़ रही है और EMA (21) से

Arief Makmur 19:08 2025-03-26 UTC+2

नैस्डैक 100 इंडेक्स के इंट्राडे मूल्य आंदोलन का तकनीकी विश्लेषण, बुधवार 26 मार्च, 2025।

20405.7 नैस्डैक 100 इंडेक्स मूल्य आंदोलन और स्टोचैस्टिक ऑसिलेटर संकेतक के बीच अभिसरण की उपस्थिति और ईएमए (21) से ऊपर जाने वाले इंडेक्स के मूल्य आंदोलन के साथ, जिसमें

Arief Makmur 19:08 2025-03-26 UTC+2

EUR/USD. 26 मार्च. नए हमले की तैयारी में भालू

मंगलवार को, EUR/USD जोड़ी ने एक बार फिर 1.0781–1.0797 के समर्थन क्षेत्र से वापसी की, लेकिन सहायक समाचार पृष्ठभूमि की कमी के कारण बुल्स ने कमजोरी दिखाई। आज, जोड़ी उसी

Samir Klishi 19:02 2025-03-26 UTC+2

GBP/USD. 26 मार्च. मुद्रास्फीति पाउंड को प्रभावित कर सकती है

प्रति घंटा चार्ट पर, GBP/USD जोड़ी ने मंगलवार को साइडवेज ट्रेड करना जारी रखा, 1.2931 के स्तर पर कोई प्रतिक्रिया नहीं दिखाई। इसलिए, इस स्तर से ऊपर या नीचे

Samir Klishi 19:02 2025-03-26 UTC+2

एयूडी/यूएसडी का पूर्वानुमान, 25 मार्च 2025 के लिए

ऑस्ट्रेलियाई डॉलर साइडवेज ट्रेंड रेंज की निचली सीमा को तोड़ने से बच गया और कल 11 पिप्स बढ़ा। हालांकि, दैनिक स्तर पर बैलेंस इंडिकेटर लाइन (लाल मूविंग एवरेज) ने कीमत

Laurie Bailey 08:32 2025-03-25 UTC+2

जीबीपी/यूएसडी का पूर्वानुमान, 25 मार्च 2025 के लिए

कल, ब्रिटिश पाउंड चार पिप्स बढ़ा, जिससे मार्लिन ऑस्सीलेटर नीचे गया और शून्य रेखा को छू लिया। अब हम उम्मीद कर सकते हैं कि ऊपर की ओर सिग्नल मजबूत होगा

Laurie Bailey 08:28 2025-03-25 UTC+2

ईयूआर/यूएसडी का पूर्वानुमान, 25 मार्च 2025 के लिए

सोमवार को यूरो 14 पिप्स गिरा। ऊपर की ओर पलटाव करने की कोशिश की गई। आज एक और कोशिश संभव है और यह अधिक सफल हो सकती है, हालांकि 1.0762

Laurie Bailey 08:20 2025-03-25 UTC+2

सोने की कमोडिटी उपकरण के इंट्राडे मूल्य गति का तकनीकी विश्लेषण, मंगलवार, 25 मार्च 2025।

अगर हम सोने की कमोडिटी उपकरण के 4 घंटे के चार्ट को देखें, तो एक बियरिश 123 पैटर्न दिखाई देता है, इसके बाद कई बियरिश रॉस हुक (RH) आते हैं

Arief Makmur 08:17 2025-03-25 UTC+2

ईयूआर/जेपीवाई क्रॉस करेंसी पेयर की इंट्राडे मूल्य गति का तकनीकी विश्लेषण, मंगलवार, 25 मार्च 2025।

जो 4 घंटे के चार्ट पर ईयूआर/जेपीवाई क्रॉस करेंसी पेयर में देखा जा रहा है, वह स्पष्ट रूप से यह दिखा रहा है कि ईयूआर/जेपीवाई एक सुदृढ़ स्थिति में बढ़

Arief Makmur 08:15 2025-03-25 UTC+2
अभी बात नहीं कर सकते?
अपना प्रश्न पूछें बातचीत.
Widget callback
 

Dear visitor,

Your IP address shows that you are currently located in the USA. If you are a resident of the United States, you are prohibited from using the services of InstaFintech Group including online trading, online transfers, deposit/withdrawal of funds, etc.

If you think you are seeing this message by mistake and your location is not the US, kindly proceed to the website. Otherwise, you must leave the website in order to comply with government restrictions.

Why does your IP address show your location as the USA?

  • - you are using a VPN provided by a hosting company based in the United States;
  • - your IP does not have proper WHOIS records;
  • - an error occurred in the WHOIS geolocation database.

Please confirm whether you are a US resident or not by clicking the relevant button below. If you choose the wrong option, being a US resident, you will not be able to open an account with InstaForex anyway.

We are sorry for any inconvenience caused by this message.