signal strength 2 of 5
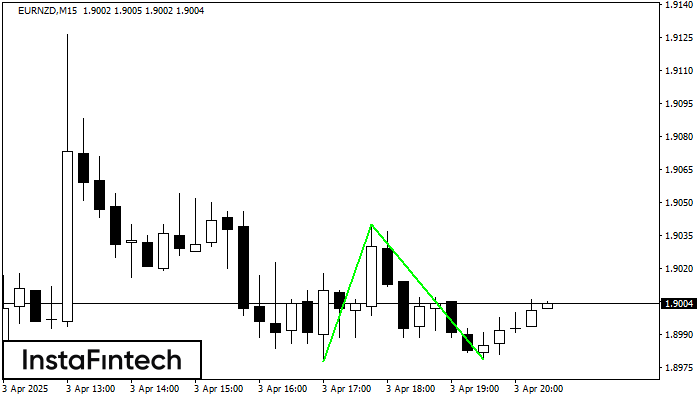
The Double Bottom pattern has been formed on EURNZD M15; the upper boundary is 1.9040; the lower boundary is 1.8979. The width of the pattern is 62 points. In case of a break of the upper boundary 1.9040, a change in the trend can be predicted where the width of the pattern will coincide with the distance to a possible take profit level.
The M5 and M15 time frames may have more false entry points.
- All
- Double Top
- Flag
- Head and Shoulders
- Pennant
- Rectangle
- Triangle
- Triple top
- All
- #AAPL
- #AMZN
- #Bitcoin
- #EBAY
- #FB
- #GOOG
- #INTC
- #KO
- #MA
- #MCD
- #MSFT
- #NTDOY
- #PEP
- #TSLA
- #TWTR
- AUDCAD
- AUDCHF
- AUDJPY
- AUDUSD
- EURCAD
- EURCHF
- EURGBP
- EURJPY
- EURNZD
- EURRUB
- EURUSD
- GBPAUD
- GBPCHF
- GBPJPY
- GBPUSD
- GOLD
- NZDCAD
- NZDCHF
- NZDJPY
- NZDUSD
- SILVER
- USDCAD
- USDCHF
- USDJPY
- USDRUB
- All
- M5
- M15
- M30
- H1
- D1
- All
- Buy
- Sale
- All
- 1
- 2
- 3
- 4
- 5
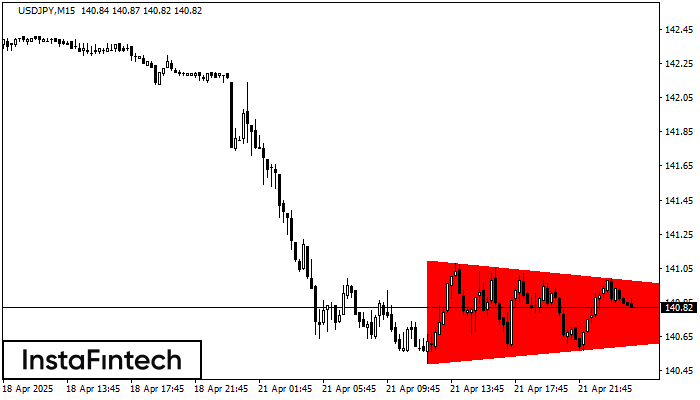
According to the chart of M15, USDJPY formed the Bearish Symmetrical Triangle pattern. Trading recommendations: A breach of the lower border 140.49 is likely to encourage a continuation
The M5 and M15 time frames may have more false entry points.
Open chart in a new window
According to the chart of M5, AUDUSD produced the pattern termed the Inverse Head and Shoulder. The Head is fixed at 0.6402 while the median line of the Neck
The M5 and M15 time frames may have more false entry points.
Open chart in a new window
According to the chart of M30, NZDJPY formed the Bearish Symmetrical Triangle pattern. Description: The lower border is 83.98/84.43 and upper border is 84.90/84.43. The pattern width is measured
Open chart in a new window