signal strength 2 of 5
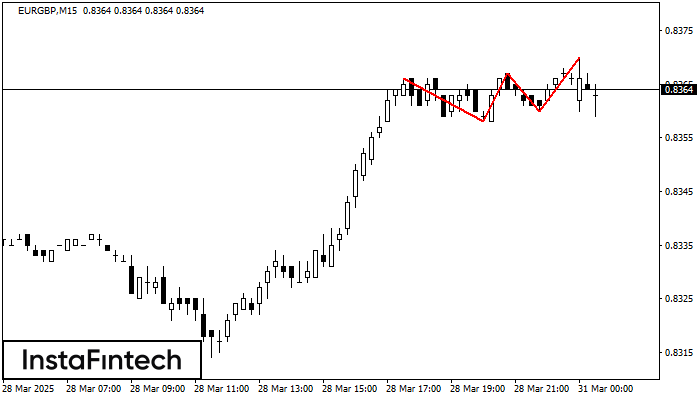
The Triple Top pattern has formed on the chart of the EURGBP M15. Features of the pattern: borders have an ascending angle; the lower line of the pattern has the coordinates 0.8358/0.8360 with the upper limit 0.8366/0.8370; the projection of the width is 8 points. The formation of the Triple Top figure most likely indicates a change in the trend from upward to downward. This means that in the event of a breakdown of the support level of 0.8358, the price is most likely to continue the downward movement.
The M5 and M15 time frames may have more false entry points.
See Also
- All
- Double Top
- Flag
- Head and Shoulders
- Pennant
- Rectangle
- Triangle
- Triple top
- All
- #AAPL
- #AMZN
- #Bitcoin
- #EBAY
- #FB
- #GOOG
- #INTC
- #KO
- #MA
- #MCD
- #MSFT
- #NTDOY
- #PEP
- #TSLA
- #TWTR
- AUDCAD
- AUDCHF
- AUDJPY
- AUDUSD
- EURCAD
- EURCHF
- EURGBP
- EURJPY
- EURNZD
- EURRUB
- EURUSD
- GBPAUD
- GBPCHF
- GBPJPY
- GBPUSD
- GOLD
- NZDCAD
- NZDCHF
- NZDJPY
- NZDUSD
- SILVER
- USDCAD
- USDCHF
- USDJPY
- USDRUB
- All
- M5
- M15
- M30
- H1
- D1
- All
- Buy
- Sale
- All
- 1
- 2
- 3
- 4
- 5

Berdasarkan carta M5, #Bitcoin membentuk corak Segi Tiga Simetri Menaik yang menandakan aliran akan berterusan. Penerangan. Sempadan atas corak menyentuh koordinat 88419.31/87233.62 sedangkan sempadan bawah merentasi 85751.59/87233.62. Lebar corak diukur
Carta masa M5 dan M15 mungkin mempunyai lebih banyak titik kemasukan palsu.
Open chart in a new window
Corak pembalikan Double Top telah dibentuk pada AUDCAD M5. Ciri-ciri: sempadan atas %P0.000000; sempadan bawah 0.8880; sempadan bawah 0.8869; lebar corak adalah 11 mata. Dagangan menjual adalah lebih baik untuk
Carta masa M5 dan M15 mungkin mempunyai lebih banyak titik kemasukan palsu.
Open chart in a new window
Corak Triple Bottom telah dibentuk pada carta bagi instrumen dagangan USDJPY M30. Corak menandakan perubahan aliran dari menurun ke aliran menaik dalam sekiranya penembusan 141.08/141.05
Open chart in a new window