signal strength 2 of 5
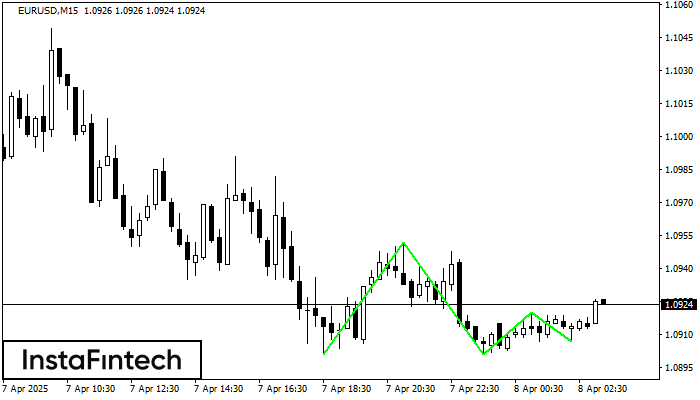
The Triple Bottom pattern has been formed on EURUSD M15. It has the following characteristics: resistance level 1.0952/1.0920; support level 1.0901/1.0907; the width is 51 points. In the event of a breakdown of the resistance level of 1.0952, the price is likely to continue an upward movement at least to 1.0924.
The M5 and M15 time frames may have more false entry points.
See Also
- All
- Double Top
- Flag
- Head and Shoulders
- Pennant
- Rectangle
- Triangle
- Triple top
- All
- #AAPL
- #AMZN
- #Bitcoin
- #EBAY
- #FB
- #GOOG
- #INTC
- #KO
- #MA
- #MCD
- #MSFT
- #NTDOY
- #PEP
- #TSLA
- #TWTR
- AUDCAD
- AUDCHF
- AUDJPY
- AUDUSD
- EURCAD
- EURCHF
- EURGBP
- EURJPY
- EURNZD
- EURRUB
- EURUSD
- GBPAUD
- GBPCHF
- GBPJPY
- GBPUSD
- GOLD
- NZDCAD
- NZDCHF
- NZDJPY
- NZDUSD
- SILVER
- USDCAD
- USDCHF
- USDJPY
- USDRUB
- All
- M5
- M15
- M30
- H1
- D1
- All
- Buy
- Sale
- All
- 1
- 2
- 3
- 4
- 5
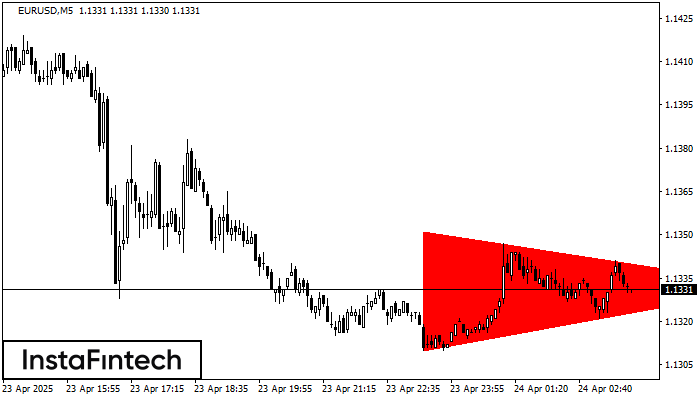
According to the chart of M5, EURUSD formed the Bearish Symmetrical Triangle pattern. This pattern signals a further downward trend in case the lower border 1.1310 is breached. Here
The M5 and M15 time frames may have more false entry points.
Open chart in a new window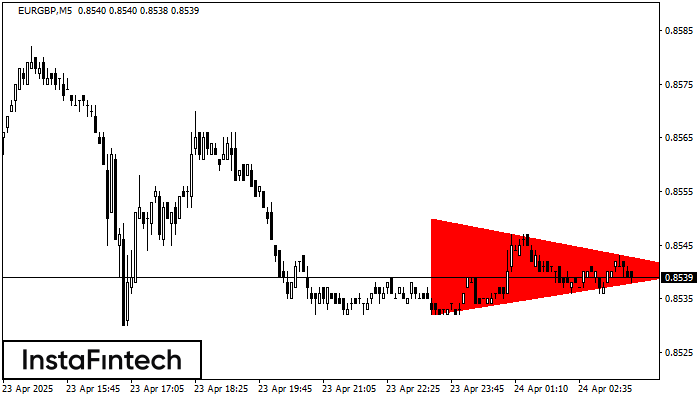
According to the chart of M5, EURGBP formed the Bearish Symmetrical Triangle pattern. This pattern signals a further downward trend in case the lower border 0.8532 is breached. Here
The M5 and M15 time frames may have more false entry points.
Open chart in a new window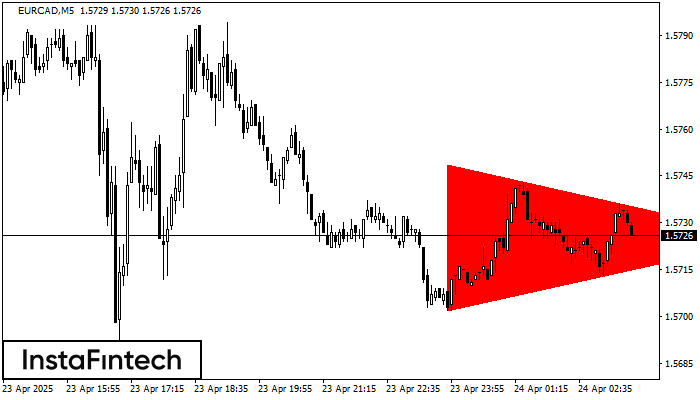
According to the chart of M5, EURCAD formed the Bearish Symmetrical Triangle pattern. This pattern signals a further downward trend in case the lower border 1.5702 is breached. Here
The M5 and M15 time frames may have more false entry points.
Open chart in a new window