

signal strength 2 of 5
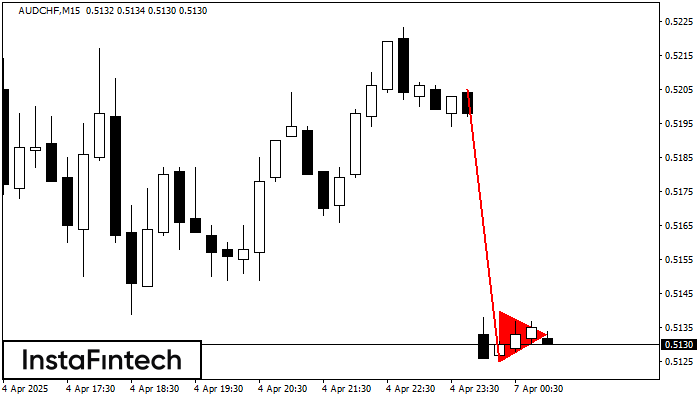
The Bearish pennant pattern has formed on the AUDCHF M15 chart. It signals potential continuation of the existing trend. Specifications: the pattern’s bottom has the coordinate of 0.5125; the projection of the flagpole height is equal to 80 pips. In case the price breaks out the pattern’s bottom of 0.5125, the downtrend is expected to continue for further level 0.5102.
The M5 and M15 time frames may have more false entry points.
- All
- Double Top
- Flag
- Head and Shoulders
- Pennant
- Rectangle
- Triangle
- Triple top
- All
- #AAPL
- #AMZN
- #Bitcoin
- #EBAY
- #FB
- #GOOG
- #INTC
- #KO
- #MA
- #MCD
- #MSFT
- #NTDOY
- #PEP
- #TSLA
- #TWTR
- AUDCAD
- AUDCHF
- AUDJPY
- AUDUSD
- EURCAD
- EURCHF
- EURGBP
- EURJPY
- EURNZD
- EURRUB
- EURUSD
- GBPAUD
- GBPCHF
- GBPJPY
- GBPUSD
- GOLD
- NZDCAD
- NZDCHF
- NZDJPY
- NZDUSD
- SILVER
- USDCAD
- USDCHF
- USDJPY
- USDRUB
- All
- M5
- M15
- M30
- H1
- D1
- All
- Buy
- Sale
- All
- 1
- 2
- 3
- 4
- 5
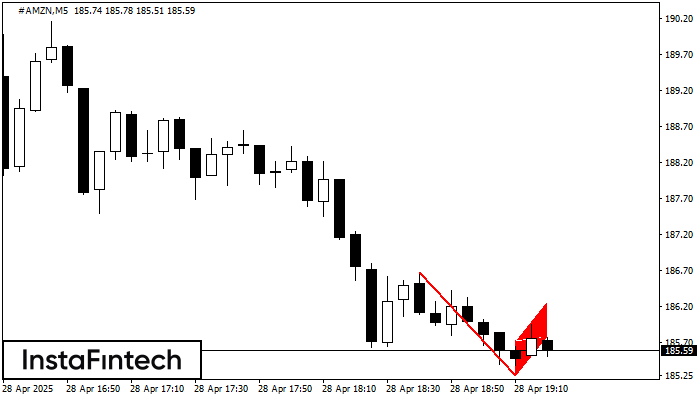
The Bearish Flag pattern has been formed on the chart #AMZN M5 which signals that the downward trend will continue. If the price breaks below the low at 185.25, then
The M5 and M15 time frames may have more false entry points.
Open chart in a new window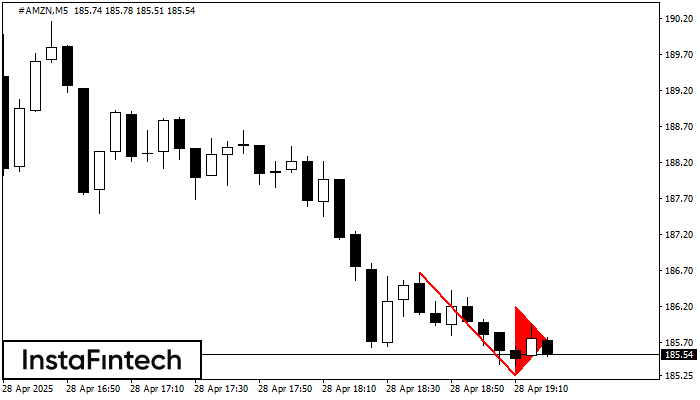
The Bearish pennant pattern has formed on the #AMZN M5 chart. The pattern signals continuation of the downtrend in case the pennant’s low of 185.25 is broken through. Recommendations: Place
The M5 and M15 time frames may have more false entry points.
Open chart in a new window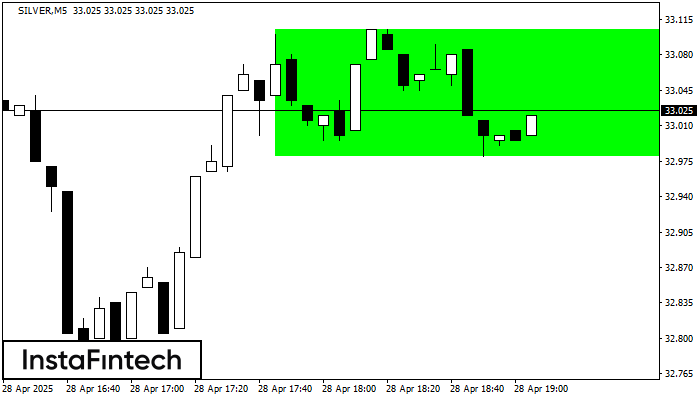
According to the chart of M5, SILVER formed the Bullish Rectangle. This type of a pattern indicates a trend continuation. It consists of two levels: resistance 33.10 and support 32.98
The M5 and M15 time frames may have more false entry points.
Open chart in a new window


