empty
27.01.2025 12:39 AM
#SPX – Weekly Results and Prospects

#SPX


This image is no longer relevant

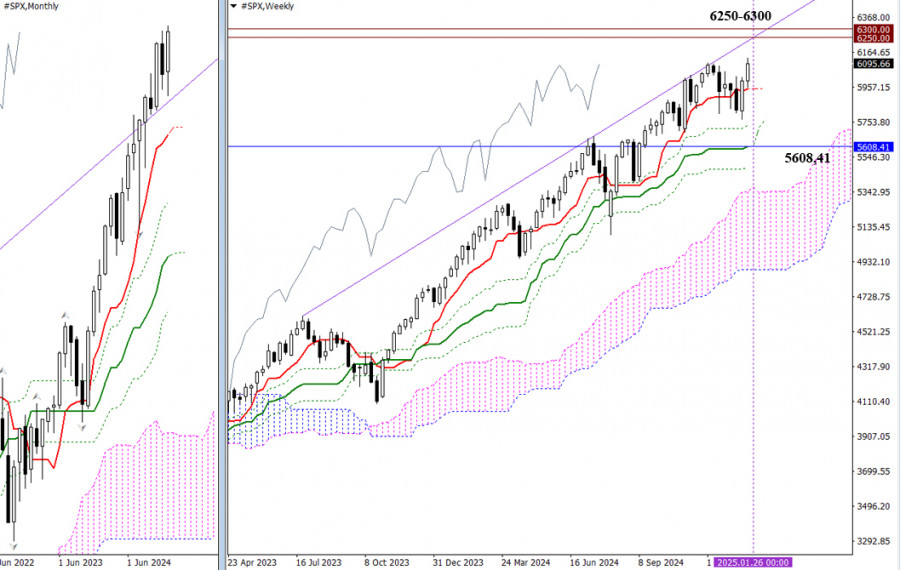
Last year, the index displayed an upward trend, correcting any bearish declines within one to two months at most. As a result, 2024 did not record a single bullish fractal, and record highs were continuously updated. By the end of the year, bearish forces attempted to slow the momentum, but January 2025 marked a new all-time high at 6127.41. In this context, the next bullish target appears to be around the psychologically significant levels of 6250 to 6300. If the bears manage to regain control, the key downside targets on higher timeframes will be the Ichimoku indicator levels: the monthly short-term trend at 5608.41 and the weekly cross supports at Tenkan 5948.42 and Kijun 5608.41.

This image is no longer relevant

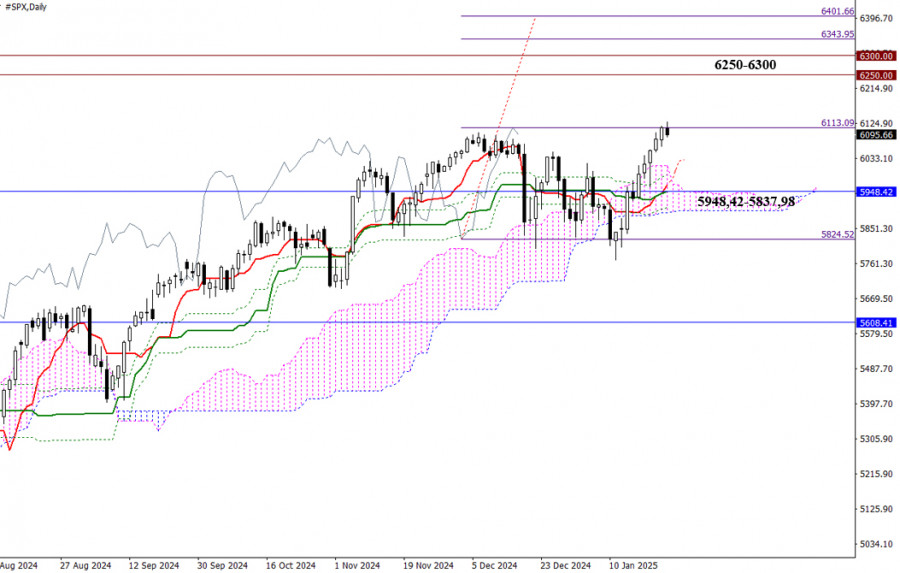
The daily chart indicates that after concluding last year with an emerging bearish correction, the index has rebounded effectively. The bulls successfully halted the decline, eliminated the daily dead cross, returned to the bullish zone above the daily cloud, and targeted an upward breakout for the Chinkou price chart. Currently, the bulls have a strong foundation to continue their upward movement. While the Chinkou Span suggests higher targets in the range of 6344 to 6402, the immediate focus should be on testing the 6250 to 6300 levels and assessing the results of this interaction. If the bulls are unable to breach these levels, the bears could push the market back towards a cluster of multiple supports, which includes the daily cross and daily cloud, near the weekly short-term trend of 5948.42. A decisive break below the range of 5948.42 to 5837.98 could set the stage for a daily downtrend and initiate a new phase of weekly bearish correction.

This image is no longer relevant

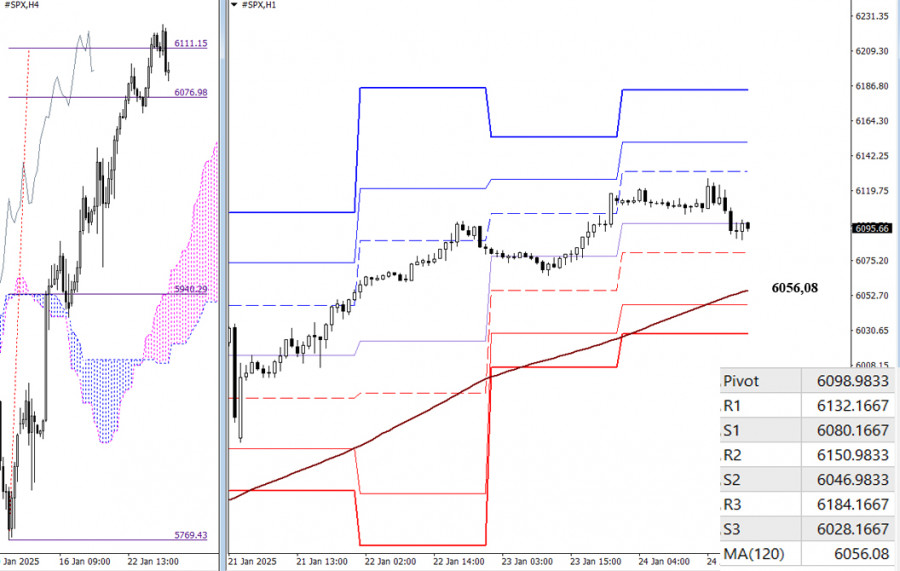
Last week, the H4 chart completed an upward movement, successfully breaking through the H4 Ichimoku cloud at 6111.15. This situation indicates that the bulls may pause, as they might lack the momentum needed for a sustained breakout and further rally. The bears are likely to take advantage of this opportunity, aiming to regain control of the lower timeframes and shift the balance of power in their favor. For the bears to succeed, they need to push the market below the weekly long-term trend at 6056.08 while reversing its current direction.

If the bulls manage to surpass the resistance at the H4 target, we can expect a resurgence of bullish activity. Additionally, the classic Pivot Points offer more references for lower timeframes. New levels will be available when the market opens.

***

Technical Analysis Components:
  • Higher Timeframes: Ichimoku Kinko Hyo (9.26.52) and Fibonacci Kijun levels
  • H1: Classic Pivot Points and 120-period Moving Average (weekly long-term trend)
Evangelos Poulakis,
Analytical expert of InstaForex
© 2007-2025
Select timeframe
5
min
15
min
30
min
1
hour
4
hours
1
day
1
week
Earn on cryptocurrency rate changes with InstaForex
Download MetaTrader 4 and open your first trade
  • Grand Choice
    Contest by
    InstaForex
    InstaForex always strives to help you
    fulfill your biggest dreams.
    JOIN CONTEST

Recommended Stories

Trading Signals for BITCOIN (BTC/USD) for February 13-16, 2025: buy above $95,000 or sell below $98,995 (21 SMA - 200 EMA)

On the other hand, as long as the price remains below $98,900, any technical bounce will be seen as an opportunity to sell. BTC is expected to reach the psychological

Dimitrios Zappas 15:43 2025-02-13 UTC+2

Trading Signals for EUR/USD for February 13-16, 2025: buy above 1.0335 (21 SMA - 200 EMA)

If the price consolidates above 1.0335 in the next few hours, the euro could gain ground. Technically, a sharp break of the bearish trend channel occurred. Therefore, the bullish trend

Dimitrios Zappas 15:35 2025-02-13 UTC+2

Trading Signals for GOLD (XAU/USD) for February 13-16, 2025: buy above $2,905 (21 SMA - 6/8 Murray)

According to the H4 chart, gold continues to show its bullish strength as the price is located above the 21 SMA, which sets the stage for a further rise

Dimitrios Zappas 15:32 2025-02-13 UTC+2

EUR/USD – February 13th: The Euro Moves Into a Sideways Trend

The EUR/USD pair continued its upward movement on Wednesday, reaching the 1.0435 level on Thursday. A rejection from this level would favor the U.S. dollar, resuming the decline toward

Samir Klishi 11:28 2025-02-13 UTC+2

GBP/USD – February 13th: A Celebration for the British Pound

On the hourly chart, the GBP/USD pair continued its upward movement on Wednesday and reached the resistance zone of 1.2488–1.2508 on Thursday. A rejection from this area would favor

Samir Klishi 11:24 2025-02-13 UTC+2

Forex forecast 13/02/2025: EUR/USD, GBP/USD, Gold and Bitcoin

Useful links: My other articles are available in this section InstaForex course for beginners Popular Analytics Open trading account Important: The begginers in forex trading need to be very careful

Sebastian Seliga 10:58 2025-02-13 UTC+2

Video analysis for February 13, 2025

Potential for the downside movement on EUR/USD

Petar Jacimovic 10:10 2025-02-13 UTC+2

GOLD: Risk of Price Decline

Recent news about negotiations between Russia and the U.S. concerning Ukraine has generated significant interest in the information space. The market is still processing this development, but the initial response

Pati Gani 09:08 2025-02-13 UTC+2

EUR/USD Forecast for February 13, 2025

U.S. inflation data surpassed expectations. The core Consumer Price Index (CPI) rose from 3.2% year-over-year (YoY) to 3.3% YoY, contrary to the forecasted decrease to 3.1% YoY. The headline

Laurie Bailey 06:41 2025-02-13 UTC+2

GBP/USD Forecast for February 13, 2025

Yesterday, the British pound traded in a range of over 100 pips, closing the day nearly at its opening level. The MACD line on the daily timeframe acted as support

Laurie Bailey 06:36 2025-02-13 UTC+2
Can't speak right now?
Ask your question in the chat.
Widget callback
 

Dear visitor,

Your IP address shows that you are currently located in the USA. If you are a resident of the United States, you are prohibited from using the services of InstaFintech Group including online trading, online transfers, deposit/withdrawal of funds, etc.

If you think you are seeing this message by mistake and your location is not the US, kindly proceed to the website. Otherwise, you must leave the website in order to comply with government restrictions.

Why does your IP address show your location as the USA?

  • - you are using a VPN provided by a hosting company based in the United States;
  • - your IP does not have proper WHOIS records;
  • - an error occurred in the WHOIS geolocation database.

Please confirm whether you are a US resident or not by clicking the relevant button below. If you choose the wrong option, being a US resident, you will not be able to open an account with InstaForex anyway.

We are sorry for any inconvenience caused by this message.