signal strength 1 of 5
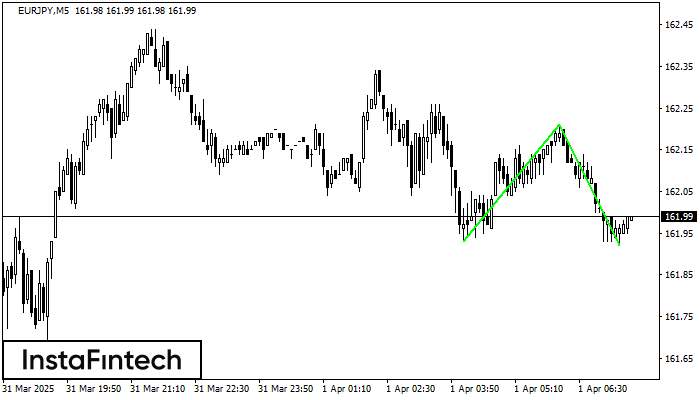
The Double Bottom pattern has been formed on EURJPY M5. Characteristics: the support level 161.93; the resistance level 162.21; the width of the pattern 28 points. If the resistance level is broken, a change in the trend can be predicted with the first target point lying at the distance of 29 points.
The M5 and M15 time frames may have more false entry points.
انظر أيضا
- All
- Double Top
- Flag
- Head and Shoulders
- Pennant
- Rectangle
- Triangle
- Triple top
- All
- #AAPL
- #AMZN
- #Bitcoin
- #EBAY
- #FB
- #GOOG
- #INTC
- #KO
- #MA
- #MCD
- #MSFT
- #NTDOY
- #PEP
- #TSLA
- #TWTR
- AUDCAD
- AUDCHF
- AUDJPY
- AUDUSD
- EURCAD
- EURCHF
- EURGBP
- EURJPY
- EURNZD
- EURRUB
- EURUSD
- GBPAUD
- GBPCHF
- GBPJPY
- GBPUSD
- GOLD
- NZDCAD
- NZDCHF
- NZDJPY
- NZDUSD
- SILVER
- USDCAD
- USDCHF
- USDJPY
- USDRUB
- All
- M5
- M15
- M30
- H1
- D1
- All
- Buy
- Sale
- All
- 1
- 2
- 3
- 4
- 5
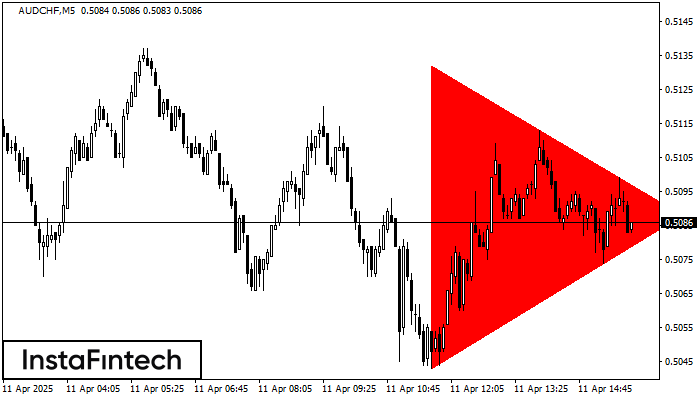
According to the chart of M5, AUDCHF formed the Bearish Symmetrical Triangle pattern. Trading recommendations: A breach of the lower border 0.5043 is likely to encourage a continuation
The M5 and M15 time frames may have more false entry points.
Open chart in a new window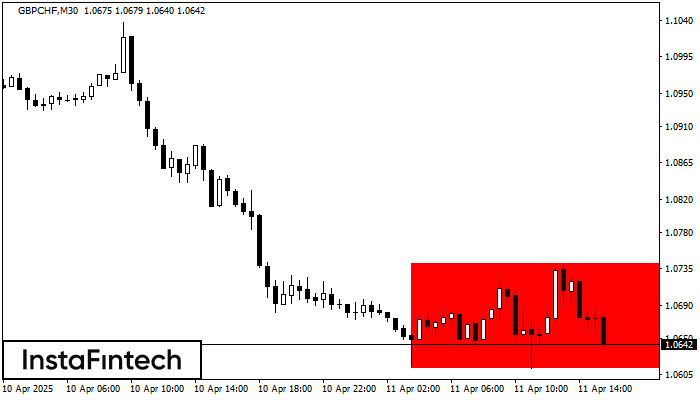
According to the chart of M30, GBPCHF formed the Bearish Rectangle which is a pattern of a trend continuation. The pattern is contained within the following borders: lower border 1.0613
Open chart in a new window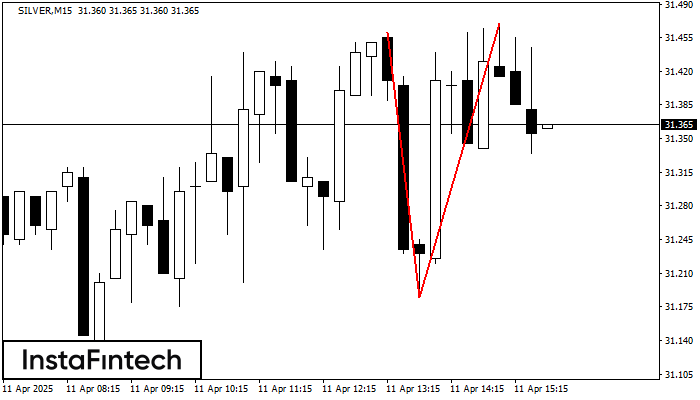
The Double Top reversal pattern has been formed on SILVER M15. Characteristics: the upper boundary 31.46; the lower boundary 31.18; the width of the pattern is 285 points. Sell trades
The M5 and M15 time frames may have more false entry points.
Open chart in a new window