empty
30.03.2023 01:28 PM
Technical analysis of BTC/USD for March 30, 2023

This image is no longer relevant

Trading BTC/USD :

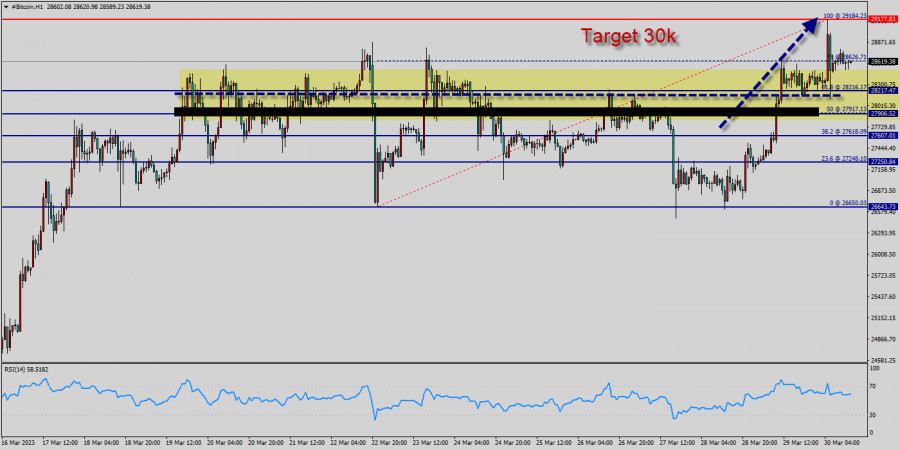
Bitcoin The bullish trend is currently very strong for BITCOIN - BTC/USD. As long as the price remains above the support at 28k USD, you could try to take advantage of the bullish rally in short term. The first bullish objective is located at 28,626 USD (this price is coincided with the ratio 78% of Fibonacci retracement levels).

The bullish momentum would be revived by a break in this resistance. Closing above the pivot point (28k USD) could assure that BTC/USD will move higher towards cooling new highs. The bulls must break through 29k USD in order to resume the up trend. Buyers would then use the next resistance located at 29,184 USD as an objective (this price is coincided with the ratio 100% of Fibonacci retracement levels - the double top - te last bullish wave on the hourly chart).

Crossing it would then enable buyers to target 29k USD. Be careful, given the powerful bullish rally underway, excesses could lead to a short-term rebound. Bitcoin's price has been consolidating between the 28k USD and 30k USD over the last few weeks, following a massive rising from the 28k USD mark.

So far, the price has been supported by the 28k USD - 27k USD range. If this is the case, remember that trading against the trend may be riskier. It would seem more appropriate to wait for a signal indicating reversal of the trend.

However, considering the current price action and the third rejection from this area, a run to the 29k USD support level and the 50-day moving average seems more likely. A bullish breakout from these levels would initiate a rally towards the 29k USD - 30k USD supply zone – a key level to which the price's reaction would determine the mid-term trend of the market.

In the very short term, the general bearish sentiment is confirmed by technical indicators. Nevertheless, a small upwards rebound in the very short term could occur in case of excessive bearish movements.

After finding bids reach to 29k USD, bitcoin price recovered above 26k USD, 27k USD and 28k USD. Initial Bitcoin resistance lies near the 28,626 USD level (78% of Fibonacci retracement levels).

A decent breakout and follow-up move above 28,626 USD could open the gate for a push towards the 29k USD level. The main resistance remains near the area of 29k USD - 30k USD.

Also it should be noted that Bitcoin and cryptocurrencies unite as the bears lose their momentum. The market is indicating a bullish opportunity above the above-mentioned support levels, for that the bullish outlook remains the same as long as the 100 EMA is headed to the upside.

Trading BTC/USD :

An uptrend will start as soon, as the market rises above resistance level 28k USD, which will be followed by moving up to resistance level 29k USD. Further close above the high end may cause a rally towards 30k USD. Nonetheless, the weekly resistance level and zone should be considered.

Mourad El Keddani,
الخبير التحليلي لدى شركة إنستافوركس
© 2007-2025
حدد الإطار الزمني
5
د
15
د
30
د
1
س
4
ساعات
1
يوم
1
أسبوع
كسب عائد من تغيرات أسعار العملات المشفرة مع إنستافوركس.
قم بتحميل منصة التداول ميتاتريدر 4 وافتح أول صفقة.
  • Grand Choice
    Contest by
    InstaForex
    InstaForex always strives to help you
    fulfill your biggest dreams.
    انضم إلى المسابقة

المقالات الموصى بها

تحليل فني لزوجي اليورو/الدولار الأمريكي والجنيه الإسترليني/الدولار الأمريكي ليوم 9 أبريل

يحاول المشترون استعادة السيطرة، ونحن نشهد حاليًا نشاطًا متزايدًا ودفعًا نحو ذروة التصحيح الجاري عند 1.1147. إن اختراق هذا المستوى سيحول تركيز السوق إلى المقاومة التاريخية عند 1.1214 و1.1276

Evangelos Poulakis 10:07 2025-04-09 UTC+2

التحليل الفني لحركة السعر اللحظية لأداة سلعة الغاز الطبيعي، الأربعاء، 9 أبريل 2025.

في الرسم البياني لمدة 4 ساعات لأداة سلعة الغاز الطبيعي، يظهر نمط هبوطي 123 يليه خطاف روس هبوطي (RH) يليه حركة سعر الغاز الطبيعي أسفل المتوسط المتحرك الأسي (EMA)

Arief Makmur 07:11 2025-04-09 UTC+2

التحليل الفني لحركة السعر اللحظية لزوج العملات السلعية USD/CAD، الأربعاء، 09 أبريل 2025.

على الرغم من أن زوج العملات السلعية USD/CAD يتحرك في قناة هبوطية على الرسم البياني لمدة 4 ساعات، إلا أنه مع تشكيل نمط صعودي 123 ووجوده فوق المتوسط المتحرك البسيط

Arief Makmur 07:11 2025-04-09 UTC+2

توقعات EUR/USD ليوم 9 أبريل 2025

بحلول نهاية يوم الثلاثاء، ارتفع اليورو بمقدار 45 نقطة، وخلال جلسة المحيط الهادئ اليوم، أضاف تقريبًا نفس المقدار، مقتربًا من مستوى الهدف 1.1027. إذا تم كسر المقاومة، قد يستهدف السعر

Laurie Bailey 04:31 2025-04-09 UTC+2

توقعات GBP/USD ليوم 9 أبريل 2025

يوم الثلاثاء، اختبر الجنيه الإسترليني الحد الأدنى من النطاق المستهدف عند 1.2816/47 مع ظل علوي. هذا الصباح، تمكن السعر من التحرك داخل هذا النطاق. سيفتح الاستقرار فوقه الطريق نحو الهدف

Laurie Bailey 04:31 2025-04-09 UTC+2

توقعات AUD/USD ليوم 9 أبريل 2025

توقفت محاولات الدولار الأسترالي للارتفاع يومي الاثنين والثلاثاء نحو مستوى الهدف 0.6133 (كما هو موضح بالظلال العلوية الطويلة)، لكن الزوج لا يزال يسعى لتحقيق هذا الهدف اليوم. يعمل مستوى 0.5943

Laurie Bailey 04:31 2025-04-09 UTC+2

إشارات التداول للذهب (XAU/USD) للفترة من 8 إلى 10 أبريل 2025: الشراء فوق $2,993 (200 EMA - ارتداد)

في وقت مبكر من الجلسة الأمريكية، يتم تداول XAU/USD حول 3010.85، تحت قناة الاتجاه الهابط التي تتشكل منذ أوائل أبريل وترتد من أدنى مستوى عند 2,948. يتم تداول الذهب

Dimitrios Zappas 14:56 2025-04-08 UTC+2

إشارات التداول لليورو/الدولار الأمريكي للفترة من 8 إلى 10 أبريل 2025: بيع تحت 1.0986 (200 EMA - 6/8 Murray)

إذا اخترق اليورو قناة الاتجاه الهابط، يمكننا أن نتوقع حركة صعودية جديدة قد تدفع زوج اليورو/الدولار الأمريكي إلى 1.1051، وهو أعلى مستوى في الأسبوع الماضي، و7/8 موراي عند 1.1115،

Dimitrios Zappas 14:54 2025-04-08 UTC+2

التوقعات لليورو/الدولار الأمريكي في 8 أبريل 2025

يوم الاثنين، قام زوج اليورو/الدولار الأمريكي بارتدادين من مستوى التصحيح 76.4%، مما أدى إلى تحول لصالح اليورو وتماسك فوق منطقة 1.0944–1.0957. ونتيجة لذلك، قد يستمر الاتجاه الصعودي نحو مستوى فيبوناتشي

Samir Klishi 10:57 2025-04-08 UTC+2

التوقعات لزوج الجنيه الإسترليني/الدولار الأمريكي في 8 أبريل 2025

على الرسم البياني للساعة، واصل زوج الجنيه الإسترليني/الدولار الأمريكي تراجعه يوم الاثنين وأنهى اليوم بالقرب من مستوى 1.2709. خلال يومي تداول فقط، انخفض الجنيه بحوالي 500 نقطة. سمح الارتداد

Samir Klishi 10:53 2025-04-08 UTC+2
لا تستطيع التحدث الآن؟
اطرح سؤالك في الدردشة.
Widget callback
 

Dear visitor,

Your IP address shows that you are currently located in the USA. If you are a resident of the United States, you are prohibited from using the services of InstaFintech Group including online trading, online transfers, deposit/withdrawal of funds, etc.

If you think you are seeing this message by mistake and your location is not the US, kindly proceed to the website. Otherwise, you must leave the website in order to comply with government restrictions.

Why does your IP address show your location as the USA?

  • - you are using a VPN provided by a hosting company based in the United States;
  • - your IP does not have proper WHOIS records;
  • - an error occurred in the WHOIS geolocation database.

Please confirm whether you are a US resident or not by clicking the relevant button below. If you choose the wrong option, being a US resident, you will not be able to open an account with InstaForex anyway.

We are sorry for any inconvenience caused by this message.